《西方经济学》课程PPT教学课件(微观经济学)Chapter 02 The Basics of Supply and Demand
Chapter 2 The Basics of Supply and Demand Supply and Demand >The Market Mechanism >Changes in Market Equilibrium >Elasticities of Supply and Demand >Short-Run versus Long-Run Elasticities >Effects of Government Intervention-Price Controls
Chapter 2 The Basics of Supply and Demand ➢ Supply and Demand ➢ The Market Mechanism ➢ Changes in Market Equilibrium ➢ Elasticities of Supply and Demand ➢ Short-Run versus Long-Run Elasticities ➢ Effects of Government Intervention-Price Controls
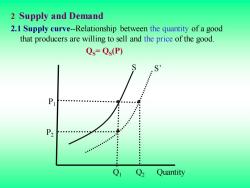
2 Supply and Demand 2.1 Supply curve-Relationship between the quantity of a good that producers are willing to sell and the price of the good. Qs=Qs(P) P2 ●● Q Q2 Quantity
2 Supply and Demand 2.1 Supply curve-Relationship between the quantity of a good that producers are willing to sell and the price of the good. QS= QS (P) Q Quantity Q1 2 P2 P1 S S’
The supply curve show how the quantity of a good offered for sale changes as the price of the good changes. The supply curve is upward sloping;the higher the price,the more firms are able and willing to produce and sell. If production costs fall,firms can produce the same quantity at a lower price or a larger quantity at the same price.The supply curve then shifts to the right
The supply curve show how the quantity of a good offered for sale changes as the price of the good changes. The supply curve is upward sloping; the higher the price, the more firms are able and willing to produce and sell. If production costs fall, firms can produce the same quantity at a lower price or a larger quantity at the same price. The supply curve then shifts to the right
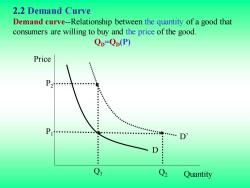
2.2 Demand Curve Demand curve-Relationship between the quantity of a good that consumers are willing to buy and the price of the good. Qp-Qp(P) Price : P2 P Quantity
2.2 Demand Curve Demand curve-Relationship between the quantity of a good that consumers are willing to buy and the price of the good. QD =QD(P) Q2 Quantity Q1 P1 P2 Price D D’
The demand curve show how the quantity of a good demanded by consumers depends on its price. The demand curve is downward sloping;holding other things equal,consumers will want to purchase more of a good the lower is its price. The quantity demanded may also depend on other variables,such as income,the weather,and the prices of other goods. For most products,the quantity demanded increases when income rises.A higher income level shifts the demand curve to the right
The demand curve show how the quantity of a good demanded by consumers depends on its price. The demand curve is downward sloping; holding other things equal, consumers will want to purchase more of a good the lower is its price. The quantity demanded may also depend on other variables, such as income, the weather, and the prices of other goods. For most products, the quantity demanded increases when income rises. A higher income level shifts the demand curve to the right
>Substitutes-Two goods for which an increase in the price of one leads to an increase in the quantity demanded of the other. >Complements-Two goods for which an increase in the price of one leads to a decrease in the quantity demanded of the other
➢ Substitutes-Two goods for which an increase in the price of one leads to an increase in the quantity demanded of the other. ➢ Complements-Two goods for which an increase in the price of one leads to a decrease in the quantity demanded of the other
2.2 The Market Mechanism Equilibrium(or market-clearing)price-Price that equates the quantity supplied to the quantity demanded. >Market mechanism-Tendency in a free market for price to change until the market clears. >Surplus-Situation in which the quantity supplied exceeds the quantity demanded. >Shortage-Situation in which the quantity demanded exceeds the quantity supplied
2.2 The Market Mechanism ➢ Equilibrium(or market-clearing)price-Price that equates the quantity supplied to the quantity demanded. ➢ Market mechanism-Tendency in a free market for price to change until the market clears. ➢ Surplus-Situation in which the quantity supplied exceeds the quantity demanded. ➢ Shortage-Situation in which the quantity demanded exceeds the quantity supplied
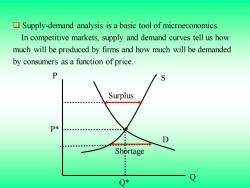
Supply-demand analysis is a basic tool of microeconomics. In competitive markets,supply and demand curves tell us how much will be produced by firms and how much will be demanded by consumers as a function of price. Surplus Shortage : : Q*
❑ Supply-demand analysis is a basic tool of microeconomics. In competitive markets, supply and demand curves tell us how much will be produced by firms and how much will be demanded by consumers as a function of price. Q P Q* P* S D Surplus Shortage
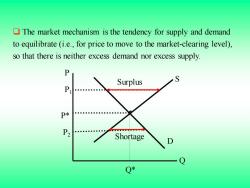
The market mechanism is the tendency for supply and demand to equilibrate (i.e.,for price to move to the market-clearing level), so that there is neither excess demand nor excess supply. P Surplus S P P* Shortage Q*
❑ The market mechanism is the tendency for supply and demand to equilibrate (i.e., for price to move to the market-clearing level), so that there is neither excess demand nor excess supply. Q* P* S D Q P P1 P2 Shortage Surplus
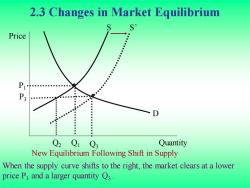
2.3 Changes in Market Equilibrium S Price P Q2 Q1 Q3 Quantity New Equilibrium Following Shift in Supply When the supply curve shifts to the right,the market clears at a lower price P3 and a larger quantity Q3
2.3 Changes in Market Equilibrium Quantity Price Q1 Q3 P3 P1 When the supply curve shifts to the right, the market clears at a lower price P3 and a larger quantity Q3 . S S’ D New Equilibrium Following Shift in Supply Q2
按次数下载不扣除下载券;
注册用户24小时内重复下载只扣除一次;
顺序:VIP每日次数-->可用次数-->下载券;
- 《西方经济学》课程PPT教学课件(微观经济学)Chapter 01 Preliminaries.ppt
- 《西方经济学》课程PPT教学课件(宏观经济学)Chapter 19 Advances in Business Cycle theory.ppt
- 《西方经济学》课程PPT教学课件(宏观经济学)Chapter 17 Investment.ppt
- 《西方经济学》课程PPT教学课件(宏观经济学)Chapter 18 Money supply and monetary Policy.ppt
- 《西方经济学》课程PPT教学课件(宏观经济学)Chapter 16 Consumption.ppt
- 《西方经济学》课程PPT教学课件(宏观经济学)Chapter 15Government Debt and Budget Deficits.ppt
- 《西方经济学》课程PPT教学课件(宏观经济学)Chapter 14 Stabilization Policy.ppt
- 《西方经济学》课程PPT教学课件(宏观经济学)Chapter 13 Aggregate supply.ppt
- 《西方经济学》课程PPT教学课件(宏观经济学)Chapter 12 Aggregate demand in open economy.ppt
- 《西方经济学》课程PPT教学课件(宏观经济学)Chapter 11 Application of IS-LM model.ppt
- 《西方经济学》课程PPT教学课件(宏观经济学)Chapter 10 The IS-LM model.ppt
- 《西方经济学》课程PPT教学课件(宏观经济学)Chapter 09 Introduction to AS-AD model.ppt
- 《西方经济学》课程PPT教学课件(宏观经济学)Chapter 07 Economic growth(1/2).ppt
- 《西方经济学》课程PPT教学课件(宏观经济学)Chapter 08 Economic growth(2/2).ppt
- 《西方经济学》课程PPT教学课件(宏观经济学)Chapter 06 Unemployment.ppt
- 《西方经济学》课程PPT教学课件(宏观经济学)Chapter 05 The open economy.ppt
- 《西方经济学》课程PPT教学课件(宏观经济学)Chapter 04 Money and inflation.ppt
- 《西方经济学》课程PPT教学课件(宏观经济学)Chapter 03 Where NI comes from and goes.ppt
- 《西方经济学》课程PPT教学课件(宏观经济学)Chapter 02 The Data of Macroeconomics.ppt
- 《西方经济学》课程PPT教学课件(宏观经济学)Chapter 01 The Science of Macroeconomics.ppt
- 《西方经济学》课程PPT教学课件(微观经济学)Chapter 03 Consumer Behavior.ppt
- 《西方经济学》课程PPT教学课件(微观经济学)Chapter 04 Individual and Market Demand.ppt
- 《西方经济学》课程PPT教学课件(微观经济学)Chapter 05 Choice under Uncertainty.ppt
- 《西方经济学》课程PPT教学课件(微观经济学)Chapter 06 Production.ppt
- 《西方经济学》课程PPT教学课件(微观经济学)Chapter 07 The Cost of Production.ppt
- 《西方经济学》课程PPT教学课件(微观经济学)Chapter 08 Profit Maximization and Competitive Supply.ppt
- 《西方经济学》课程PPT教学课件(微观经济学)Chapter 09 The Analysis of Competitive Markets.ppt
- 《西方经济学》课程PPT教学课件(微观经济学)Chapter 10 Market Power.ppt
- 《西方经济学》课程PPT教学课件(微观经济学)Chapter 11 Pricing with Market Power.ppt
- 《西方经济学》课程PPT教学课件(微观经济学)Chapter 12 Monopolistic Competition.ppt
- 《西方经济学》课程PPT教学课件(微观经济学)Chapter 13 Game Theory.ppt
- 《西方经济学》课程PPT教学课件(微观经济学)Chapter 14 Markets for Factor Inputs.ppt
- 《西方经济学》课程PPT教学课件(微观经济学)Chapter 15 Investment, Time, and Capital.ppt
- 《西方经济学》课程PPT教学课件(微观经济学)Chapter 16 General Equilibrium and Economic Efficiency.ppt
- 《西方经济学》课程PPT教学课件(微观经济学)Chapter 17 Markets with Asymmetric Information.ppt
- 《西方经济学》课程PPT教学课件(微观经济学)Chapter 18 Externalities.ppt
- 《西方经济学》课程PPT教学课件(微观经济学)Chapter 17 Microeconomics.ppt
- 海南大学:《成本会计》课程课程教学大纲 COST ACCOUNTING.pdf
- 海南大学:《成本会计》课程教学资源(教案讲义)第一章 总论.doc
- 海南大学:《成本会计》课程教学资源(教案讲义)第三章 成本汇集与分配.doc
