《西方经济学》课程PPT教学课件(微观经济学)Chapter 10 Market Power
Chapter 10 Market Power: Monopoly and Monopsony Chapter Outline Monopoly Monopoly Power >Sources of Monopoly Power >The Social Costs of Monopoly Power Monopsony Power Limiting Market Power:The Antitrust Laws
Chapter 10 Market Power: Monopoly and Monopsony Chapter Outline ➢ Monopoly ➢ Monopoly Power ➢ Sources of Monopoly Power ➢ The Social Costs of Monopoly Power ➢ Monopsony Power ➢ Limiting Market Power: The Antitrust Laws
10.1 Monopoly Monopoly-Market with only one seller Monopoly power-The ability of a firm to profitably charge a price higher than marginal cost. Monopsony-Market with only one buyer. Monopsony power-Buyer's ability to affect the price of a good. Marginal revenue-Change in revenue resulting from a 1 unit increase in output
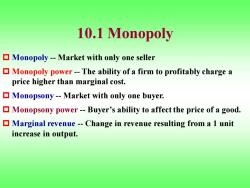
10.1 Monopoly Monopoly - Market with only one seller Monopoly power - The ability of a firm to profitably charge a price higher than marginal cost. Monopsony - Market with only one buyer. Monopsony power - Buyer’s ability to affect the price of a good. Marginal revenue - Change in revenue resulting from a 1 unit increase in output

Dollars per Unit of Output 6 4 Average Revenue(Demand) 3 2 Marginal Revenue 1 0 1 2 3 4 5 6 7 Output Average and Marginal Revenue Average and marginal revenue are shown for the demand curve P=6-Q R=PQ=Q(6-Q)=6Q-Q2,AR=6-Q MR=6-2Q
Average and Marginal Revenue Average and marginal revenue are shown for the demand curve P = 6 – Q R = PQ = Q(6 – Q) = 6Q – Q2 , AR = 6 - Q MR = 6 – 2Q
Price MC P1 P2 Lost profit from producing too little(Q1)and selling at D=AR too high a price(P1) Lost profit from producing too much(Q2)and selling at too low a price(P2) MR Q1 Q+ Q2 Quantity Profit is Maximized When Marginal Revenue Equals Marginal Cost
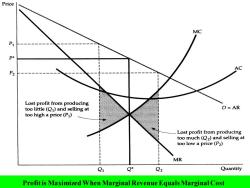
Profit is Maximized When Marginal Revenue Equals Marginal Cost
Q*is the output level at which MR=MC (n=R-C,profit-maximization △π/△Q=△R/△Q-△CI△Q=0). If the firm produces a smaller output-say,Q-it sacrifices some profit because the extra revenue that could be earned for producing and selling the units between Q and Q*exceeds cost of producing them. Similarly,expanding output from Q*to Q2 would reduce profit because the additional cost would exceed the additional revenue
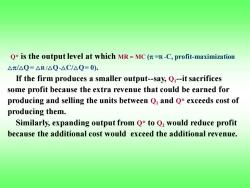
Q* is the output level at which MR = MC ( =R -C, profit-maximization △/△Q = △R /△Q-△C/△Q= 0). If the firm produces a smaller output-say, Q1 -it sacrifices some profit because the extra revenue that could be earned for producing and selling the units between Q1 and Q* exceeds cost of producing them. Similarly, expanding output from Q* to Q2 would reduce profit because the additional cost would exceed the additional revenue
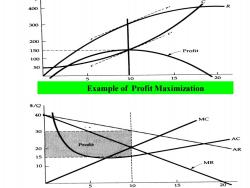
400 R 300 200 150 Profit 100 50 5 10 15 20 Example of Profit Maximization 8 40 MC 30 AC 20 AR 15 MR 10 15 20
Example of Profit Maximization
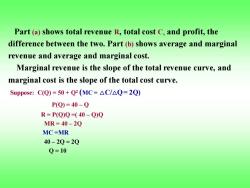
Part (a)shows total revenue R,total cost C,and profit,the difference between the two.Part(b)shows average and marginal revenue and average and marginal cost. Marginal revenue is the slope of the total revenue curve,and marginal cost is the slope of the total cost curve. Suppose:C(Q)=50+Q2(MC=△C/△Q=2Q) P(Q)=40-Q R=P(Q)Q=(40-Q)Q MR=40-2Q MC=MR 40-2Q=20 Q=10
Part (a) shows total revenue R, total cost C, and profit, the difference between the two. Part (b) shows average and marginal revenue and average and marginal cost. Marginal revenue is the slope of the total revenue curve, and marginal cost is the slope of the total cost curve. Suppose: C(Q) = 50 + Q2 (MC = △C/△Q = 2Q) P(Q) = 40 – Q R = P(Q)Q =( 40 – Q)Q MR = 40 – 2Q MC =MR 40 – 2Q = 2Q Q = 10
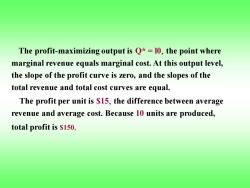
The profit-maximizing output is Q*=10,the point where marginal revenue equals marginal cost.At this output level, the slope of the profit curve is zero,and the slopes of the total revenue and total cost curves are equal. The profit per unit is $15,the difference between average revenue and average cost.Because 10 units are produced, total profit is $150
The profit-maximizing output is Q* = l0, the point where marginal revenue equals marginal cost. At this output level, the slope of the profit curve is zero, and the slopes of the total revenue and total cost curves are equal. The profit per unit is $15, the difference between average revenue and average cost. Because 10 units are produced, total profit is $150
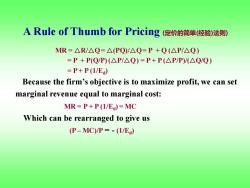
A Rule of Thumb for Pricing(定价的简单(经验)法则) MR=△R/△Q=△(PQ)/△Q=P+Q(△P/△Q) =P+P(QP)(△P/△Q)=P+P(△P/P)/△Q/Q) =P+P(1/E) Because the firm's objective is to maximize profit,we can set marginal revenue equal to marginal cost: MR=P+P(1/E)=MC Which can be rearranged to give us P-MC)/P=-(1/Ea)
MR = △R/△Q = △(PQ)/△Q = P + Q (△P/△Q ) = P + P(Q/P) (△P/△Q ) = P + P (△P/P)/(△Q/Q ) = P + P (1/Ed ) Because the firm’s objective is to maximize profit, we can set marginal revenue equal to marginal cost: MR = P + P (1/Ed ) = MC Which can be rearranged to give us (P – MC)/P = - (1/Ed ) A Rule of Thumb for Pricing (定价的简单(经验)法则)
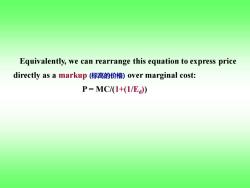
Equivalently,we can rearrange this equation to express price directly as a markup(标高的价格)over marginal cost: P=MC/1+(1/E)
Equivalently, we can rearrange this equation to express price directly as a markup (标高的价格) over marginal cost: P = MC/(1+(1/Ed ))
按次数下载不扣除下载券;
注册用户24小时内重复下载只扣除一次;
顺序:VIP每日次数-->可用次数-->下载券;
- 《西方经济学》课程PPT教学课件(微观经济学)Chapter 09 The Analysis of Competitive Markets.ppt
- 《西方经济学》课程PPT教学课件(微观经济学)Chapter 08 Profit Maximization and Competitive Supply.ppt
- 《西方经济学》课程PPT教学课件(微观经济学)Chapter 07 The Cost of Production.ppt
- 《西方经济学》课程PPT教学课件(微观经济学)Chapter 06 Production.ppt
- 《西方经济学》课程PPT教学课件(微观经济学)Chapter 05 Choice under Uncertainty.ppt
- 《西方经济学》课程PPT教学课件(微观经济学)Chapter 04 Individual and Market Demand.ppt
- 《西方经济学》课程PPT教学课件(微观经济学)Chapter 03 Consumer Behavior.ppt
- 《西方经济学》课程PPT教学课件(微观经济学)Chapter 02 The Basics of Supply and Demand.ppt
- 《西方经济学》课程PPT教学课件(微观经济学)Chapter 01 Preliminaries.ppt
- 《西方经济学》课程PPT教学课件(宏观经济学)Chapter 19 Advances in Business Cycle theory.ppt
- 《西方经济学》课程PPT教学课件(宏观经济学)Chapter 17 Investment.ppt
- 《西方经济学》课程PPT教学课件(宏观经济学)Chapter 18 Money supply and monetary Policy.ppt
- 《西方经济学》课程PPT教学课件(宏观经济学)Chapter 16 Consumption.ppt
- 《西方经济学》课程PPT教学课件(宏观经济学)Chapter 15Government Debt and Budget Deficits.ppt
- 《西方经济学》课程PPT教学课件(宏观经济学)Chapter 14 Stabilization Policy.ppt
- 《西方经济学》课程PPT教学课件(宏观经济学)Chapter 13 Aggregate supply.ppt
- 《西方经济学》课程PPT教学课件(宏观经济学)Chapter 12 Aggregate demand in open economy.ppt
- 《西方经济学》课程PPT教学课件(宏观经济学)Chapter 11 Application of IS-LM model.ppt
- 《西方经济学》课程PPT教学课件(宏观经济学)Chapter 10 The IS-LM model.ppt
- 《西方经济学》课程PPT教学课件(宏观经济学)Chapter 09 Introduction to AS-AD model.ppt
- 《西方经济学》课程PPT教学课件(微观经济学)Chapter 11 Pricing with Market Power.ppt
- 《西方经济学》课程PPT教学课件(微观经济学)Chapter 12 Monopolistic Competition.ppt
- 《西方经济学》课程PPT教学课件(微观经济学)Chapter 13 Game Theory.ppt
- 《西方经济学》课程PPT教学课件(微观经济学)Chapter 14 Markets for Factor Inputs.ppt
- 《西方经济学》课程PPT教学课件(微观经济学)Chapter 15 Investment, Time, and Capital.ppt
- 《西方经济学》课程PPT教学课件(微观经济学)Chapter 16 General Equilibrium and Economic Efficiency.ppt
- 《西方经济学》课程PPT教学课件(微观经济学)Chapter 17 Markets with Asymmetric Information.ppt
- 《西方经济学》课程PPT教学课件(微观经济学)Chapter 18 Externalities.ppt
- 《西方经济学》课程PPT教学课件(微观经济学)Chapter 17 Microeconomics.ppt
- 海南大学:《成本会计》课程课程教学大纲 COST ACCOUNTING.pdf
- 海南大学:《成本会计》课程教学资源(教案讲义)第一章 总论.doc
- 海南大学:《成本会计》课程教学资源(教案讲义)第三章 成本汇集与分配.doc
- 海南大学:《成本会计》课程教学资源(教案讲义)第二章 成本核算方法体系.doc
- 海南大学:《成本会计》课程教学资源(教案讲义)第五章 分步成本计算.doc
- 海南大学:《成本会计》课程教学资源(教案讲义)第六章 分类法.doc
- 海南大学:《成本会计》课程教学资源(教案讲义)第四章 单步骤成本计算方法.doc
- 海南大学:《成本会计》课程教学资源(教案讲义)第七章 作业成本计算.doc
- 海南大学:《成本会计》课程教学资源(教案讲义)第九章 标准成本法.doc
- 海南大学:《成本会计》课程教学资源(教案讲义)第十章 成本报表与成本分析.doc
- 海南大学:《成本会计》课程教学资源(试卷习题)各章题库(含参考答案).doc
