《西方经济学》课程PPT教学课件(微观经济学)Chapter 06 Production
Chapter 6 Production Chapter Outline >The Technology of Production >[soquants(等产量线) >Production with one Variable Input >Production with Two Variable Inputs >Returns to Scale(规模报酬)
Chapter 6 Production Chapter Outline ➢ The Technology of Production ➢ Isoquants (等产量线) ➢ Production with one Variable Input ➢ Production with Two Variable Inputs ➢ Returns to Scale (规模报酬)
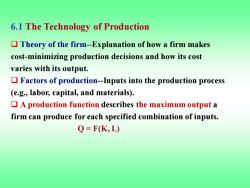
6.1 The Technology of Production Theory of the firm-Explanation of how a firm makes cost-minimizing production decisions and how its cost varies with its output. Factors of production-Inputs into the production process (e.g.,labor,capital,and materials). A production function describes the maximum output a firm can produce for each specified combination of inputs. Q=FK,L)
6.1 The Technology of Production ❑ Theory of the firm-Explanation of how a firm makes cost-minimizing production decisions and how its cost varies with its output. ❑ Factors of production-Inputs into the production process (e.g., labor, capital, and materials). ❑ A production function describes the maximum output a firm can produce for each specified combination of inputs. Q = F(K, L)
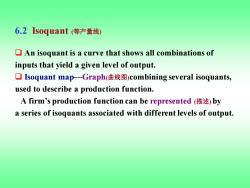
6.2Is0 quant(等产量线) An isoquant is a curve that shows all combinations of inputs that yield a given level of output. ▣Isoquant map-Graph(曲线图)combining several isoquants, used to describe a production function. A firm's production function can be represented by a series of isoquants associated with different levels of output
❑ An isoquant is a curve that shows all combinations of inputs that yield a given level of output. ❑ Isoquant map—Graph(曲线图)combining several isoquants, used to describe a production function. A firm’s production function can be represented (描述)by a series of isoquants associated with different levels of output. 6.2 Isoquant (等产量线)
Production with Two Variable Inputs Captial per Year 5 3 DCC0 ■■■■■■■■■■ A B: 2。 Q3=90 ■■■■■■■■ Q2=75 Q1=55 3 (Labor per Year)
Production with Two Variable Inputs A B C Q1 = 55 Q2 = 75 Q3 = 90 (Labor per Year) Captial per Year 1 2 3 1 3 5 D E 2 F
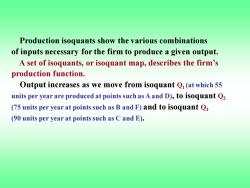
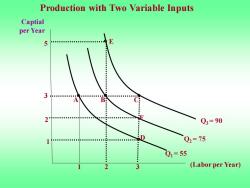
Production isoquants show the various combinations of inputs necessary for the firm to produce a given output. A set of isoquants,or isoquant map,describes the firm's production function. Output increases as we move from isoquant Q(at which 55 units per year are produced at points such as A and D),to isoquant Q2 (75 units per year at points such as B and F)and to isoquant Q3 (90 units per year at points such as C and E)
Production isoquants show the various combinations of inputs necessary for the firm to produce a given output. A set of isoquants, or isoquant map, describes the firm’s production function. Output increases as we move from isoquant Q1 (at which 55 units per year are produced at points such as A and D), to isoquant Q2 (75 units per year at pointssuch as B and F) and to isoquant Q3 (90 units per year at pointssuch as C and E)
Short run-Period of time in which quantities of one or more production factors cannot be changed. Fixed input-Production factor that cannot be varied. Long run-Amount of time needed to make all production inputs variable
• Short run-Period of time in which quantities of one or more production factors cannot be changed. • Fixed input-Production factor that cannot be varied. • Long run-Amount of time needed to make all production inputs variable
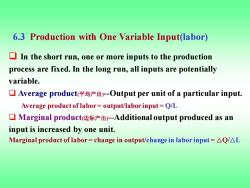
6.3 Production with One Variable Input(labor) In the short run,one or more inputs to the production process are fixed.In the long run,all inputs are potentially variable. □Average product(平均产出)-Output per unit of a particular input. Average product of labor=output/labor input=Q/L ▣Marginal product边际产出)-Additional output produced as an input is increased by one unit. Marginal product of labor=change in output/change in labor input=AQ/AL
❑ In the short run, one or more inputs to the production process are fixed.In the long run, all inputs are potentially variable. ❑ Average product(平均产出)-Output per unit of a particular input. Average product of labor = output/labor input = Q/L ❑ Marginal product(边际产出)-Additional output produced as an input is increased by one unit. Marginal product of labor = change in output/change in labor input = △Q/△L 6.3 Production with One Variable Input(labor)
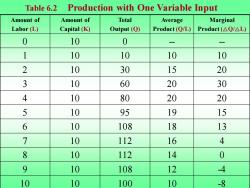
Table 6.2 Production with One Variable Input Amount of Amount of Total Average Marginal Labor (L) Capital(K) Output (Q) Product(Q/L) Product(△Q/△L 0 10 0 1 10 10 10 10 2 10 30 15 20 3 10 60 20 30 4 10 80 20 20 5 10 95 19 15 6 10 108 18 13 7 10 112 16 4 8 10 112 14 0 9 10 108 12 -4 10 10 100 10 -8
Amount of Labor (L) Amount of Capital (K) Total Output (Q) Average Product (Q/L) Marginal Product (△Q/△L) 0 10 0 - - 1 10 10 10 10 2 10 30 15 20 3 10 60 20 30 4 10 80 20 20 5 10 95 19 15 6 10 108 18 13 7 10 112 16 4 8 10 112 14 0 9 10 108 12 -4 10 10 100 10 -8 Table 6.2 Production with One Variable Input
Output 112 D Per ■■■■■■■■ Month 80 Total Product 60 B A Output (a) Labor Per Month Per 30 Worker Per Month Average Product 20 10 Marginal Product b Labor Per Month
Output Per Month Labor Per Month Labor Per Month Marginal Product Average Product Total Product 1 3 4 8 10 20 30 60 112 E A B C D (a) (b) Output Per Worker Per Month 80 O
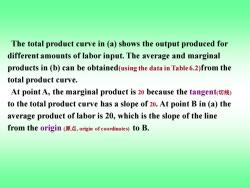
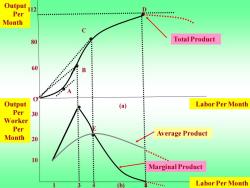
The total product curve in (a)shows the output produced for different amounts of labor input.The average and marginal products in (b)can be obtained(using the data in Table 6.2)from the total product curve. At point A,the marginal product is 20 because the tangent() to the total product curve has a slope of 20.At point B in (a)the average product of labor is 20,which is the slope of the line from the origin(原点,origin of coordinates)toB
The total product curve in (a) shows the output produced for different amounts of labor input. The average and marginal products in (b) can be obtained(using the data in Table 6.2)from the total product curve. At point A, the marginal product is 20 because the tangent(切线) to the total product curve has a slope of 20. At point B in (a) the average product of labor is 20, which is the slope of the line from the origin (原点, origin of coordinates) to B
按次数下载不扣除下载券;
注册用户24小时内重复下载只扣除一次;
顺序:VIP每日次数-->可用次数-->下载券;
- 《西方经济学》课程PPT教学课件(微观经济学)Chapter 05 Choice under Uncertainty.ppt
- 《西方经济学》课程PPT教学课件(微观经济学)Chapter 04 Individual and Market Demand.ppt
- 《西方经济学》课程PPT教学课件(微观经济学)Chapter 03 Consumer Behavior.ppt
- 《西方经济学》课程PPT教学课件(微观经济学)Chapter 02 The Basics of Supply and Demand.ppt
- 《西方经济学》课程PPT教学课件(微观经济学)Chapter 01 Preliminaries.ppt
- 《西方经济学》课程PPT教学课件(宏观经济学)Chapter 19 Advances in Business Cycle theory.ppt
- 《西方经济学》课程PPT教学课件(宏观经济学)Chapter 17 Investment.ppt
- 《西方经济学》课程PPT教学课件(宏观经济学)Chapter 18 Money supply and monetary Policy.ppt
- 《西方经济学》课程PPT教学课件(宏观经济学)Chapter 16 Consumption.ppt
- 《西方经济学》课程PPT教学课件(宏观经济学)Chapter 15Government Debt and Budget Deficits.ppt
- 《西方经济学》课程PPT教学课件(宏观经济学)Chapter 14 Stabilization Policy.ppt
- 《西方经济学》课程PPT教学课件(宏观经济学)Chapter 13 Aggregate supply.ppt
- 《西方经济学》课程PPT教学课件(宏观经济学)Chapter 12 Aggregate demand in open economy.ppt
- 《西方经济学》课程PPT教学课件(宏观经济学)Chapter 11 Application of IS-LM model.ppt
- 《西方经济学》课程PPT教学课件(宏观经济学)Chapter 10 The IS-LM model.ppt
- 《西方经济学》课程PPT教学课件(宏观经济学)Chapter 09 Introduction to AS-AD model.ppt
- 《西方经济学》课程PPT教学课件(宏观经济学)Chapter 07 Economic growth(1/2).ppt
- 《西方经济学》课程PPT教学课件(宏观经济学)Chapter 08 Economic growth(2/2).ppt
- 《西方经济学》课程PPT教学课件(宏观经济学)Chapter 06 Unemployment.ppt
- 《西方经济学》课程PPT教学课件(宏观经济学)Chapter 05 The open economy.ppt
- 《西方经济学》课程PPT教学课件(微观经济学)Chapter 07 The Cost of Production.ppt
- 《西方经济学》课程PPT教学课件(微观经济学)Chapter 08 Profit Maximization and Competitive Supply.ppt
- 《西方经济学》课程PPT教学课件(微观经济学)Chapter 09 The Analysis of Competitive Markets.ppt
- 《西方经济学》课程PPT教学课件(微观经济学)Chapter 10 Market Power.ppt
- 《西方经济学》课程PPT教学课件(微观经济学)Chapter 11 Pricing with Market Power.ppt
- 《西方经济学》课程PPT教学课件(微观经济学)Chapter 12 Monopolistic Competition.ppt
- 《西方经济学》课程PPT教学课件(微观经济学)Chapter 13 Game Theory.ppt
- 《西方经济学》课程PPT教学课件(微观经济学)Chapter 14 Markets for Factor Inputs.ppt
- 《西方经济学》课程PPT教学课件(微观经济学)Chapter 15 Investment, Time, and Capital.ppt
- 《西方经济学》课程PPT教学课件(微观经济学)Chapter 16 General Equilibrium and Economic Efficiency.ppt
- 《西方经济学》课程PPT教学课件(微观经济学)Chapter 17 Markets with Asymmetric Information.ppt
- 《西方经济学》课程PPT教学课件(微观经济学)Chapter 18 Externalities.ppt
- 《西方经济学》课程PPT教学课件(微观经济学)Chapter 17 Microeconomics.ppt
- 海南大学:《成本会计》课程课程教学大纲 COST ACCOUNTING.pdf
- 海南大学:《成本会计》课程教学资源(教案讲义)第一章 总论.doc
- 海南大学:《成本会计》课程教学资源(教案讲义)第三章 成本汇集与分配.doc
- 海南大学:《成本会计》课程教学资源(教案讲义)第二章 成本核算方法体系.doc
- 海南大学:《成本会计》课程教学资源(教案讲义)第五章 分步成本计算.doc
- 海南大学:《成本会计》课程教学资源(教案讲义)第六章 分类法.doc
- 海南大学:《成本会计》课程教学资源(教案讲义)第四章 单步骤成本计算方法.doc
