同济大学:《应用统计学》课程教学资源(试卷习题)考核试卷(B卷)2011-2012学年第2学期(无答案)
Applied Statistics(B).June.2012 同济大学课程考核试卷(B卷) 2011-2012 学年第2学期 Final Exam(B)for Applied Statistics.(Open Book) Tongji University,Second Semester of 2011-2012 Instructions: You have 2 hours for the exam.To receive full credit.you must hand in your exam You may use the lecture notes and the te xtbook during the exam.You can also use a calculator or a laptop.If you use EXCEL to obtain a final result,you'd better write out the processes in EXCELabout how to get the final result. Show your work for each question.The logic underly ing your analysis is m ore important than the final answer.I have tried to leave a gen erous amount of space to answer each question.Of course,do not feel that you need to fill up all the space. When in doubt,ask.I will rarely be sym pathetic if you answer a questio n incorrectly because you misinterpreted it. Good luck! Student I.D. Name
Applied Statistics (B), June, 2012 1 同济大学课程考核试卷(B 卷) 2011—2012 学年第 2 学期 Final Exam (B) for Applied Statistics. (Open Book) Tongji University, Second Semester of 2011-2012 Instructions: You have 2 hours for the exam . To receive full credit, you must hand in your exam promptly at the end of all the allotted time. Be sure to answer all question s. There are total 8 pages including this instruction page. You may use the lecture notes and the te xtbook during the exam . You can also use a calculator or a laptop. If you use EXCEL to obtain a final result, you’d better write out the processes in EXCEL about how to get the final result. Show your work for each question. The logic underly ing your analysis is m ore important than the final answer . I h ave tried to leave a gen erous amount of space to answer each question. Of course, do not feel that you need to fill up all the space. When in doubt, ask. I will rarely be sym pathetic if you answer a questio n incorrectly because you misinterpreted it. Good luck! Student I.D.______________________________________ Name ____________________________________________
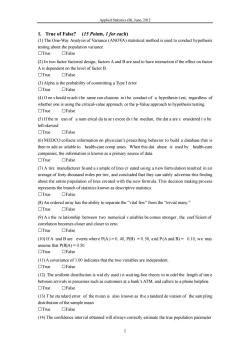
Applied Statistics(B).June.201 1.True of False?(15 Points.I for each) (1)The One-Way Analysis of Variance (ANOVA)statistical method isused toconduct hypothesis the popuation variance True ☐False (2)ntwo factor factorial design,factorsAand Baresaid to have interaction if facto A is dependent on the level of factor B. ☐True☐False (3)Alpha is the probability of committing a ☐True☐False (4)Oneshould reach the same conclusions in the conduct of a hypothesistest,regardless of whether one is using the critical-value approach,or the p-Value approach to hypothesis testing. ☐True☐False (5)Ifthe m ean of a num erical da tasetexcee dsthe median,the dat aarec onsideredtobe left-skewed True口False (6)MEDCOcollects information on physician's prescribing behavior to build a database that is then m ade av ailable to health-care comp anies.When this dat abase is used by health-care companies,the information is known as a primary source of data. OTrue False (7)A tire manufacturer found as ample of tires cr eated using a new formulation resulted in an average of forty-thousand miles per tire,and concluded that they can safely advertise this finding represents the b ch of known s descriptive statistics. ■True ☐False (8)An orderedarray has the ability to separate the"vital fewfrom the"ivial many. OTrue False (9As the relationship between two numerical variables be comes stronger,the coefficient of scloserand closer toer True口Fal (1)A and Bare events where P(A).0.P(B).50,and P(Aand B)0.10,we may assume that P(BA)=0.50. ☐True ☐False (11)Acovariance of 100 indicates that the two variables are independent ▣True☐False (12)Theform distribution is aiting-ine theory tomode the lengthoftim between arrivals in processes such as customers at a bank's ATM,and callers to a phone helpline ▣True ☐False (13)The standard error of the mean is also known as thestandard de viation of the sam pling distribution of the sample mean □True□False (14)The confidence interval obtained will always estimate the true population parameter
Applied Statistics (B), June, 2012 2 1. True of False? (15 Points, 1 for each) (1) The One-Way Analysis of Variance (ANOVA) statistical method is used to conduct hypothesis testing about the population variance □True □False (2) In two factor factorial design, factors A and B are said to have interaction if the effect on factor A is dependent on the level of factor B. □True □False (3) Alpha is the probability of committing a Type I error □True □False (4) O ne s hould re ach t he same con clusions in t he conduct of a hypothesis t est, regardless of whether one is using the critical-value approach, or the p-Value approach to hypothesis testing. □True □False (5) If the m ean of a num erical da ta se t excee ds t he median, the dat a are c onsidered t o be left-skewed □True □False (6) MEDCO collects information on physician’s prescribing behavior to build a database that is then m ade av ailable to health-care comp anies. When this dat abase is used by health-care companies, the information is known as a primary source of data. □True □False (7) A tire manufacturer fo und a s ample of tires cr eated usi ng a n ew formulation result ed in a n average of forty-thousand miles per tire, and concluded that they can safely advertise this finding about the entire population of tires created with the new formula. This decision making process represents the branch of statistics known as descriptive statistics. □True □False (8) An ordered array has the ability to separate the “vital few” from the “trivial many.” □True □False (9) A s the re lationship between two numerical v ariables be comes stronger , the coef ficient of correlation becomes closer and closer to zero. □True □False (10) If A and B are events wher e P(A ) = 0. 40, P(B) = 0. 50, a nd P (A and B) = 0.10, w e may assume that P(B|A) = 0.50. □True □False (11) A covariance of 1.00 indicates that the two variables are independent. □True □False (12) The uniform distribution is wid ely used i n waiting-line theory to m odel the length of tim e between arrivals in processes such as customers at a bank’s ATM, and callers to a phone helpline. □True □False (13) T he sta ndard error of the m ean is also known as th e s tandard de viation of the sam pling distribution of the sample mean □True □False (14) The confidence interval obtained will always correctly estimate the true population parameter
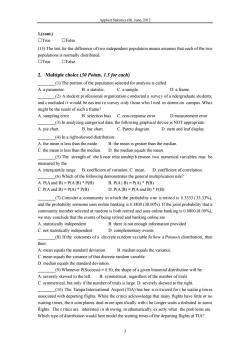
Applied Statistics (B).June.01 1.(cont.) OTrue ▣False (15)The test for the difference of two independent population means assumes that each of the two populations is normally distributed. True □Ealse 2.Multiple choice(30 Points,1.5 for each) (1)The portion of the population selected for analysis iscalled A.a parameter B.a statistic C.a sample. D.a frame (2)A student professional organization conducted a survey of u ndergraduate students and concluded it would be easiest to survey only those wholived in dorms on campus.What might be the result of such a frame? A.sampling error B.selection bias C.non-response error D.measurement error (3)In analyzing categorical data.the following graphical device is NOT appropriate A.pie chart. B.bar chart. C.Pareto diagram. D.stem and leaf display. (4)In a right-skewed distribution A.the mean is less than the mode. B.the mean is greater than the median C.the mean is less than the median. D.the median equals the mean. (5)The strength of the linear relat ionship between two numerical variables may be measured by the A.range of variation.C.mean D.coefficient of correlation of the following dem trates the general? A.P(Aand B)=P(A B)*P(B) B.P(AB)=P(A)*P(B) C.P(A and B)=PA)◆PB) D.P(A |B)=P(A and B)*P(B) (7)Consider a community in which the probability one is retired is 0.3333(33.33%) and the probability someone uses online banking is3800(3800%).If the joint probability that a community member selected at random is both retired and uses online banking is 0.0800(800%). we may conclude that the events of being retired and banking online are ndent B.there is not enoug information provided D.complementary events (8)If the outcomes of a dis crete random variable follow a Poisson distribution.then their A.mean equals the standard deviation. B.median equals the variance C.the variance of that discrete random variable. D.standard deviation (9)Whenever P(Success)=0.50,the shape of a given binomial distribution will be A.severely skewed to the left B.symmetrical.regardless of the number of trials C.symmetrical,but only if the number of trials is large.D.severely skewed to the right. (10)The Tampa Intemational Airport (TIA)has bee ncriticized for t he waiting times associated with departing the that many fights have lit dle or n waiting times,the ir complaints deal more spec ifically with t he longer waits a ttributed to some flights.The c ritics are interested inshowing.m athematically,ex actly what the prob lems are. Which type of distribution would best model the waiting times of the departing flights at TIA? 3
Applied Statistics (B), June, 2012 3 1.(cont.) □True □False (15) The test for the difference of two independent population means assumes that each of the two populations is normally distributed. □True □False 2. Multiple choice (30 Points, 1.5 for each) ________(1) The portion of the population selected for analysis is called: A. a parameter. B. a statistic. C. a sample. D. a frame. ________(2) A student professional organization conducted a survey of u ndergraduate students, and c oncluded i t w ould be eas iest t o s urvey o nly t hose w ho l ived in dorms on campus. Wha t might be the result of such a frame? A. sampling error B. selection bias C. non-response error D.measurement error ________(3) In analyzing categorical data, the following graphical device is NOT appropriate: A. pie chart. B. bar chart. C. Pareto diagram. D. stem and leaf display. ________(4) In a right-skewed distribution: A. the mean is less than the mode. B. the mean is greater than the median. C. the mean is less than the median. D. the median equals the mean. ________(5) The strength of the li near relat ionship b etween two numerical vari ables may be measured by the A. interquartile range. B. coefficient of variation. C. mean. D. coefficient of correlation. ________(6) Which of the following demonstrates the general multiplication rule? A. P(A and B) = P(A |B) * P(B) B. P(A | B) = P(A) * P(B) C. P(A and B) = P(A) * P(B) D. P(A |B) = P(A and B) * P(B) ________(7) Consider a community in which the probability one is retired is 0.3333 (33.33%), and the probability someone uses online banking is 0.3800 (38.00%). If the joint probability that a community member selected at random is both retired and uses online banking is 0.0800 (8.00%), we may conclude that the events of being retired and banking online are A. statistically independent B. there is not enough information provided C. not statistically independent D. complementary events ________(8) If the outcomes of a dis crete ra ndom va riable fo llow a Poisso n distribution, then their: A. mean equals the standard deviation. B. median equals the variance. C. mean equals the variance of that discrete random variable. D. median equals the standard deviation. ________(9) Whenever P(Success) = 0.50, the shape of a given binomial distribution will be: A. severely skewed to the left. B. symmetrical, regardless of the number of trials C. symmetrical, but only if the number of trials is large. D. severely skewed to the right. ________(10) The Tampa Intern ational Airport (TIA) has bee n cri ticized for t he waitin g tim es associated with departing flights. While the critics acknowledge that many flights have little or no waiting t imes, the ir com plaints deal m ore spec ifically with t he l onger waits a ttributed to som e flights. The c ritics are interested i n sh owing, m athematically, ex actly what the prob lems are. Which type of distribution would best model the waiting times of the departing flights at TIA?
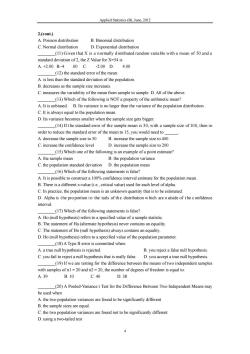
Applied Statistics(B).June.0 2.(cont) A.Poisson distribution B.Binomial distribution C.Normal dist bution D.Expon ntial distribution (11)Given that X is a normally distributed random variable with a mean of 50 and a standard deviation of 2.the Z Value for X=54 is A.+2.00B.4.00C. -2.00D.4.00 (12)the standard error of the mean: A.is less than the standard deviation of the populatior B.decreases as the sample size increases C.measures the variability of the mean from sample to sample.D.All of the above (13)Which of the following is NOT a property of the arithmetic mean? A.It is unbiased.B.Its variance is no larger than the variance of the population distribution C.It the population mea D.Its variance becomes smaller when the sample size gets bigger (14)Ifthe standard error of the sample mean is 30.with a sample size of 100.then in order to reduce the standard error of the mean to 15.you would need to A decrease the sample size to 50 B.increase the sample size to 400 C.increase the confidence level D.increase the sample size to (15)Which one of the following is an example ofa point estimate? A.the sample mean B.the population variance C.the population standard deviation D.the population mean (16)Which of the following statements is false? A.It is possible to construct a 100%confidence interval estimate for the population mean. B.There is a differen value (ic alue)used for each level ofalp C.In practice,the population mean is an unknown quantity that is tobe estimated D.Alpha is the proportionin the tails of the distribution which are outside of the confidence interval. (17)Which of the following statements is false? C.The statement of Ho (null hypothesis)always contains an equality. D.Ho(null hypothesis)refers to a specified value of the population parameter. (18)A Type II error is committed when: A.a true null hypothesis is rejected. B.you reject a false null hypothesis c you fail to hypothesis that is realy false. D.you accept a tru ull hypothesi (19)If we are testing for the difference between the means of two independent samples with samples of nl=20 and n2=20,the number of degrees of freedom is equal to: A39 B.10 C.40 D.38 (20)A Pooled-Variancet Test for the Difference Between Two Independent Means may be used when A.the two population variances are found to be significantly different B.the sample sizes are equal. C.the two population variances are found not to be significantly different D.using a two-tailed test 4
Applied Statistics (B), June, 2012 4 2.(cont.) A. Poisson distribution B. Binomial distribution C. Normal distribution D. Exponential distribution ________(11) Given that X is a normally distributed random variable with a mean of 50 and a standard deviation of 2, the Z Value for X=54 is A. +2.00 B.-4 .00 C. -2.00 D. 4.00 ________(12) the standard error of the mean: A. is less than the standard deviation of the population. B. decreases as the sample size increases. C. measures the variability of the mean from sample to sample. D. All of the above. ________(13) Which of the following is NOT a property of the arithmetic mean? A. It is unbiased. B. Its variance is no larger than the variance of the population distribution. C. It is always equal to the population mean. D. Its variance becomes smaller when the sample size gets bigger. ________(14) If t he standard error of the sample mean is 30, with a sample size of 100, then in order to reduce the standard error of the mean to 15, you would need to ______. A. decrease the sample size to 50 B. increase the sample size to 400 C. increase the confidence level D. increase the sample size to 200 ________(15) Which one of the following is an example of a point estimate? A. the sample mean B. the population variance C. the population standard deviation D. the population mean ________(16) Which of the following statements is false? A. It is possible to construct a 100% confidence interval estimate for the population mean. B. There is a different z-value (i.e., critical value) used for each level of alpha. C. In practice, the population mean is an unknown quantity that is to be estimated. D. Alpha is t he pro portion i n the tails of th e distribution w hich are o utside of t he c onfidence interval. ________(17) Which of the following statements is false? A. Ho (null hypothesis) refers to a specified value of a sample statistic. B. The statement of Ha (alternate hypothesis) never contains an equality. C. The statement of Ho (null hypothesis) always contains an equality. D. Ho (null hypothesis) refers to a specified value of the population parameter. ________(18) A Type II error is committed when: A. a true null hypothesis is rejected. B. you reject a false null hypothesis. C. you fail to reject a null hypothesis that is really false. D. you accept a true null hypothesis. ________(19) If we are testing for the difference between the means of two independent samples with samples of n1 = 20 and n2 = 20, the number of degrees of freedom is equal to: A. 39 B. 10 C. 40 D. 38 ________(20) A Pooled-Variance t Test for the Difference Between Two Independent Means may be used when A. the two population variances are found to be significantly different B. the sample sizes are equal. C. the two population variances are found not to be significantly different D. using a two-tailed test
Applied Statistics(B).June.012 3.(10 Points)An advertising executive is studying television viewing habits of married men and women duri ng pr ime.nthe basis of past ds,theex ecutive has detemined thatduring prime time,husb ands are been determined that when the husband is watching televison,%of the time the wife is also watching.When the husband is not wat ching television,30%ofthe time the wife is watching television.Find the probability that (1)if the wife is watching television,the husband is also watching television? (2)the wife is watching television in prime time?
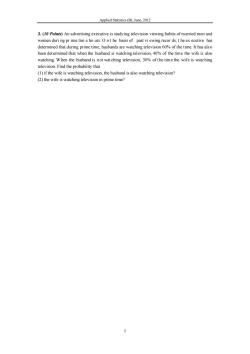
Applied Statistics (B), June, 2012 5 3. (10 Points) An advertising executive is studying television viewing habits of married men and women duri ng pr ime tim e ho urs. O n t he basis of past vi ewing recor ds, t he ex ecutive has determined that during prime time, husbands are watching television 60% of the time. It has als o been determined that when the husband is watching television, 40% of the time the wife is also watching. W hen the husband is n ot wat ching television, 30% of t he tim e the wif e is watc hing television. Find the probability that (1) if the wife is watching television, the husband is also watching television? (2) the wife is watching television in prime time?
Applied Statisties (B).June.201 4.(15 Points)Unisys.com is one of the most frequented business-to-business web sites.According to theartice in The Wall Street Joual busines the ongestaverage time fbue-u iness web sit Assume that the length of a visit on the Unisys web sit is di stributed as a no rmal random variable with a mean of 65.7 minutes and a standard deviation of 15 minutes. (1)What is the probability that a randomly selected visit will last more than 9 minutes? (2)What is the probability that a randomly selected visit to Unisys.com will last between 60 and (3)Between what two values(in minutes)symmetrically distributed around the population mean will 9%of the visits last? (4)Only 20%of the visits will last less than how many minutes?
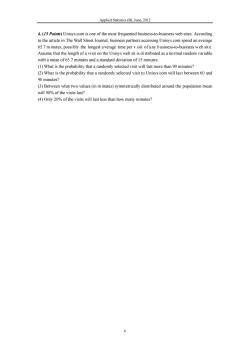
Applied Statistics (B), June, 2012 6 4. (15 Points) Unisys.com is one of the most frequented business-to-business web sites. According to the article in The Wall Street Journal, business partners accessing Unisys.com spend an average 65.7 m inutes, possi bly the longest a verage time per v isit of a ny b usiness-to-business w eb sit e. Assume that the length of a visit on the Unisys web sit is di stributed as a no rmal random variable with a mean of 65.7 minutes and a standard deviation of 15 minutes. (1) What is the probability that a randomly selected visit will last more than 90 minutes? (2) What is the probability that a randomly selected visit to Unisys.com will last between 60 and 90 minutes? (3) Between what two values (in minutes) symmetrically distributed around the population mean will 90% of the visits last? (4) Only 20% of the visits will last less than how many minutes?
Applied Statistics(B).June.012 5.(15 Points)Astationery store wants to estimate the mean retail value of greeting cardsthat it has in its inventory.Arandom sample of 20 greeting cards indicates an average value of$167and (1)Assuming a normal distribution,set upa%confidence interval estimate of the mean value of all greeting cards in the store's inventory. (2)How might the results obtained in(1)be useful in assisting the store owner to estimate the total value of her inventory?
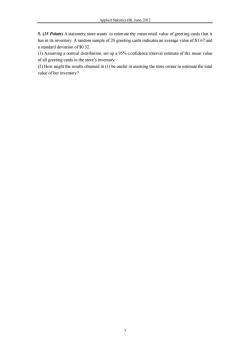
Applied Statistics (B), June, 2012 7 5. (15 Points) A stationery store wants to estimate the mean retail value of greeting cards t hat it has in its inventory. A random sample of 20 greeting cards indicates an average value of $1.67 and a standard deviation of $0.32. (1) Assuming a normal distribution, set up a 95% c onfidence interval estimate of the mean value of all greeting cards in the store’s inventory. (2) How might the results obtained in (1) be useful in assisting the store owner to estimate the total value of her inventory?
Applied Statistics(B).June.0 6.(15 Points)The manager of computer operations of a large company wants to study computer usage of two departments within the m pany-hendepar n ent and the re department.A random sample offivejobs from the accounting deparment in the past weekan six jobs from the research department in the past wee k are selected,and the processing time (in seconds)for each job is recorded. Processing time (Seconds) ing Research 19 23 13 38 10 47 512 6 6 Use al evel of sig nificance of 0.05(or 95%confidence)an d use sta tistical inference(ie. intervalsor tests of hypothesis) (1)Estimate the mean processing time for all jobs in the accounting department (2)Is there evidence that the mean processing time in the research department is greater than 6 seconds? (3)Is there evide nce of a dif ference between the vari ances in t he processing times of the two (4)What assumption must be made in(3)? 8
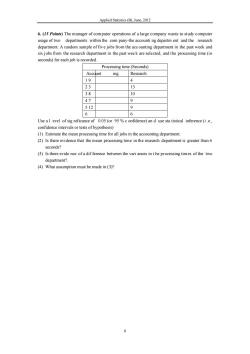
Applied Statistics (B), June, 2012 8 6. (15 Points) The manager of computer operations of a large company wants to study computer usage of two departments within the com pany-the accounti ng departm ent and the research department. A random sample of fiv e jobs from the acc ounting department in the past week and six jobs from the research department in the past wee k are selected, and the processing time (in seconds) for each job is recorded. Processing time (Seconds) Account ing Research 1 9 4 2 3 13 3 8 10 4 7 9 5 12 9 6 6 Use a l evel of sig nificance of 0.05 (or 95 % c onfidence) an d use sta tistical inference (i .e., confidence intervals or tests of hypothesis) (1) Estimate the mean processing time for all jobs in the accounting department. (2) Is there evidence that the mean processing time in the research department is greater than 6 seconds? (3) Is there evide nce of a dif ference between the vari ances in t he pr ocessing tim es of the two department?. (4) What assumption must be made in (3)?
按次数下载不扣除下载券;
注册用户24小时内重复下载只扣除一次;
顺序:VIP每日次数-->可用次数-->下载券;
- 同济大学:《应用统计学》课程教学资源(试卷习题)考核试卷(A卷)2011-2012学年第2学期(无答案).pdf
- 新乡医学院:《卫生统计学》课程教学资源(课件讲稿,打印版)实验五 统计表与统计图.pdf
- 新乡医学院:《卫生统计学》课程教学资源(教案讲义,打印版)实验五 统计表与统计图.pdf
- 新乡医学院:《卫生统计学》课程教学资源(课件讲稿,打印版)实验四 卡方检验.pdf
- 新乡医学院:《卫生统计学》课程教学资源(教案讲义,打印版)实验四 卡方检验(教师:晁灵).pdf
- 新乡医学院:《卫生统计学》课程教学资源(课件讲稿,打印版)实验三 方差分析实验.pdf
- 新乡医学院:《卫生统计学》课程教学资源(教案讲义,打印版)实验三 方差分析.pdf
- 新乡医学院:《卫生统计学》课程教学资源(课件讲稿,打印版)实验二 总体均数的区间估计假设检验(t检验).pdf
- 新乡医学院:《卫生统计学》课程教学资源(教案讲义,打印版)实验二 总体均数的区间估计假设检验(t检验).pdf
- 新乡医学院:《卫生统计学》课程教学资源(课件讲稿,打印版)实验一 计算器使用和计量资料描述(定量资料的统计描述).pdf
- 新乡医学院:《卫生统计学》课程教学资源(教案讲义,打印版)实验一 计量资料描述和计算器使用.pdf
- 南京农业大学:《生物统计与试验设计实验》课程教学大纲.pdf
- 南京农业大学:《统计实习》课程教学大纲.pdf
- 《物流经济学》课程电子教案(PPT教学课件讲稿,共十二章).pptx
- 中国科学技术大学:《应用时间序列分析》课程教学资源(课件讲稿)第六章 多元时间序列分析.pdf
- 中国科学技术大学:《应用时间序列分析》课程教学资源(课件讲稿)第五章 非平稳序列的随机性分析.pdf
- 中国科学技术大学:《应用时间序列分析》课程教学资源(课件讲稿)第四章 非平稳序列的确定性分析.pdf
- 中国科学技术大学:《应用时间序列分析》课程教学资源(课件讲稿)第三章 平稳时间序列分析.pdf
- 中国科学技术大学:《应用时间序列分析》课程教学资源(课件讲稿)第二章 时间序列的预处理.pdf
- 中国科学技术大学:《应用时间序列分析》课程教学资源(课件讲稿)第一章 时间序列分析简介.pdf
- 同济大学:《应用统计学》课程电子教案(课件讲稿)Chapter 1 Introduction and Data Collection(Applied Statistics).pdf
- 同济大学:《应用统计学》课程电子教案(课件讲稿)Chapter 2 Presenting Data in Tables and Charts.pdf
- 同济大学:《应用统计学》课程电子教案(课件讲稿)Chapter 3 Numerical Descriptive Measures.pdf
- 同济大学:《应用统计学》课程电子教案(课件讲稿)Chapter 4 Basic Probability(主讲:王世进).pdf
- 同济大学:《应用统计学》课程电子教案(课件讲稿)Chapter 6 The Normal Distribution and Other Continuous Distributions.pdf
- Chapter 7 Confidence Interval Estimation.pdf
- 同济大学:《应用统计学》课程电子教案(课件讲稿)Chapter 8 Fundamentals of Hypothesis Testing(One-Sample Tests).pdf
- 同济大学:《应用统计学》课程电子教案(课件讲稿)Chapter 9 Two-Sample Tests with Numerical Data.pdf
- 同济大学:《应用统计学》课程电子教案(课件讲稿)Chapter 10 Analysis of Variance(ANOVA).pdf
- 同济大学:《应用统计学》课程电子教案(课件讲稿)Chapter 11 Simple Linear Regression.pdf
- 同济大学:《应用统计学》课程电子教案(课件讲稿)Chapter 12 Time series based Demand Management.pdf
- 同济大学:《应用统计学》课程电子教案(课件讲稿)Chapter 13 Statistical Applications in Quality Management.pdf
- 同济大学:《应用统计学》课程电子教案(课件讲稿)Chapter 5 The Normal Distribution and Sampling Distributions.ppt
- 《概率论与数理统计》课程教学资源(整理资料)Matlab在统计方面的应用.pdf
- 《概率论与数理统计》课程教学资源(整理资料)正态分布的前世今生.pdf
- 《概率论与数理统计》课程教学资源(PPT讲稿)概率论与数理统计知识点总结.pptx
- 西安电子科技大学:《随机过程概论》课程教学资源(课件讲稿)Chapter 4 随机过程通过线性系统.pdf
- 西安电子科技大学:《随机过程概论》课程教学资源(课件讲稿)Chapter 9 检测理论.pdf
- 沈阳航空航天大学:自动化学院《误差理论及数据处理》课程教学大纲.pdf
- 吉林大学:《医学统计学》课程电子教案(PPT课件)第一章 医学统计中的基本概念、第二章 平均水平(集中趋势)的统计描述(主讲:田迎春).ppt
