同济大学:《应用统计学》课程电子教案(课件讲稿)Chapter 13 Statistical Applications in Quality Management
Chapter 13 Statistical Applications in Quality Management Statistics for Managers Using Microsoft Excel
Statistics for Managers Using Microsoft Excel Chapter 13 Statistical Applications in Quality Management
Learning Objectives In this chapter,you learn: How to construct various control charts Which control charts to use for a particular type of data How to measure the capability of a process The basic themes of quality management and Deming's 14 points The basic aspects of Six Sigma Statistics for Managers Using Microsoft Excel
Statistics for Managers Using Microsoft Excel Learning Objectives In this chapter, you learn: How to construct various control charts Which control charts to use for a particular type of data How to measure the capability of a process The basic themes of quality management and Deming’s 14 points The basic aspects of Six Sigma
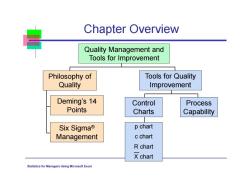
Chapter Overview Quality Management and Tools for Improvement Philosophy of Tools for Quality Quality Improvement Deming's 14 Control Process Points Charts Capability Six Sigma® p chart Management c chart R chart X chart Statistics for Managers Using Microsoft Excel
Statistics for Managers Using Microsoft Excel Chapter Overview Quality Management and Tools for Improvement Deming’s 14 Points Six Sigma® Management Process Capability Philosophy of Quality Tools for Quality Improvement Control Charts p chart c chart R chart X chart
Theory of Control Charts DCOVA A process is the value added transformation of inputs to outputs Control Charts are used to monitor variation in a measured value from a process Inherent variation refers to process variation that exists naturally.This variation can be reduced but not eliminated Statistics for Managers Using Microsoft Excel
Statistics for Managers Using Microsoft Excel Theory of Control Charts A process is the value added transformation of inputs to outputs Control Charts are used to monitor variation in a measured value from a process Inherent variation refers to process variation that exists naturally. This variation can be reduced but not eliminated DCOVA
Theory of Control Charts (continued) DCOVA Control charts indicate when changes in data are due to: Special or assignable causes Fluctuations not inherent to a process -Represents problems to be corrected Data outside control limits or trend Chance or common causes -Inherent random variations Consist of numerous small causes of random variability Statistics for Managers Using Microsoft Excel
Statistics for Managers Using Microsoft Excel Theory of Control Charts Control charts indicate when changes in data are due to: Special or assignable causes Fluctuations not inherent to a process Represents problems to be corrected Data outside control limits or trend Chance or common causes Inherent random variations Consist of numerous small causes of random variability (continued) DCOVA
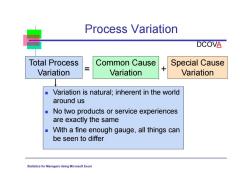
Process Variation DCOVA Total Process Common Cause Special Cause Variation Variation Variation Variation is natural;inherent in the world around us No two products or service experiences are exactly the same With a fine enough gauge,all things can be seen to differ Statistics for Managers Using Microsoft Excel
Statistics for Managers Using Microsoft Excel Process Variation Total Process Variation Common Cause Variation Special Cause Variation = + Variation is natural; inherent in the world around us No two products or service experiences are exactly the same With a fine enough gauge, all things can be seen to differ DCOVA
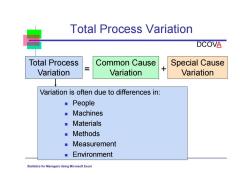
Total Process Variation DCOVA Total Process Common Cause Special Cause X Variation Variation Variation Variation is often due to differences in: ■People ■Machines ■Materials ■Methods ■ Measurement Environment Statistics for Managers Using Microsoft Excel
Statistics for Managers Using Microsoft Excel Total Process Variation Total Process Variation Common Cause Variation Special Cause Variation = + People Machines Materials Methods Measurement Environment Variation is often due to differences in: DCOVA
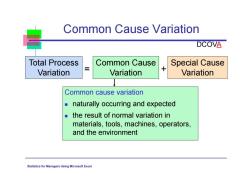
Common Cause Variation DCOVA Total Process Common Cause Special Cause Variation Variation Variation Common cause variation naturally occurring and expected the result of normal variation in materials,tools,machines,operators, and the environment Statistics for Managers Using Microsoft Excel
Statistics for Managers Using Microsoft Excel Common Cause Variation Total Process Variation Common Cause Variation Special Cause Variation = + Common cause variation naturally occurring and expected the result of normal variation in materials, tools, machines, operators, and the environment DCOVA
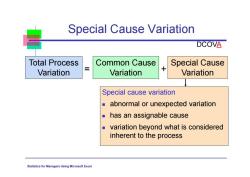
Special Cause Variation DCOVA Total Process Common Cause Special Cause Variation Variation Variation Special cause variation abnormal or unexpected variation has an assignable cause variation beyond what is considered inherent to the process Statistics for Managers Using Microsoft Excel
Statistics for Managers Using Microsoft Excel Special Cause Variation Total Process Variation Common Cause Variation Special Cause Variation = + Special cause variation abnormal or unexpected variation has an assignable cause variation beyond what is considered inherent to the process DCOVA
Two Kinds Of Errors DCOVA Treating common cause variation as special cause variation Results in over overadjusting known as tampering Increases process variation Treating special cause variation as common cause variation Results in not taking corrective action when it should be taken Utilizing control charts greatly reduces the chance of committing either of these errors Statistics for Managers Using Microsoft Excel
Statistics for Managers Using Microsoft Excel Two Kinds Of Errors Treating common cause variation as special cause variation Results in over overadjusting known as tampering Increases process variation Treating special cause variation as common cause variation Results in not taking corrective action when it should be taken Utilizing control charts greatly reduces the chance of committing either of these errors DCOVA
按次数下载不扣除下载券;
注册用户24小时内重复下载只扣除一次;
顺序:VIP每日次数-->可用次数-->下载券;
- 同济大学:《应用统计学》课程电子教案(课件讲稿)Chapter 12 Time series based Demand Management.pdf
- 同济大学:《应用统计学》课程电子教案(课件讲稿)Chapter 11 Simple Linear Regression.pdf
- 同济大学:《应用统计学》课程电子教案(课件讲稿)Chapter 10 Analysis of Variance(ANOVA).pdf
- 同济大学:《应用统计学》课程电子教案(课件讲稿)Chapter 9 Two-Sample Tests with Numerical Data.pdf
- 同济大学:《应用统计学》课程电子教案(课件讲稿)Chapter 8 Fundamentals of Hypothesis Testing(One-Sample Tests).pdf
- Chapter 7 Confidence Interval Estimation.pdf
- 同济大学:《应用统计学》课程电子教案(课件讲稿)Chapter 6 The Normal Distribution and Other Continuous Distributions.pdf
- 同济大学:《应用统计学》课程电子教案(课件讲稿)Chapter 4 Basic Probability(主讲:王世进).pdf
- 同济大学:《应用统计学》课程电子教案(课件讲稿)Chapter 3 Numerical Descriptive Measures.pdf
- 同济大学:《应用统计学》课程电子教案(课件讲稿)Chapter 2 Presenting Data in Tables and Charts.pdf
- 同济大学:《应用统计学》课程电子教案(课件讲稿)Chapter 1 Introduction and Data Collection(Applied Statistics).pdf
- 同济大学:《应用统计学》课程教学资源(试卷习题)考核试卷(B卷)2011-2012学年第2学期(无答案).pdf
- 同济大学:《应用统计学》课程教学资源(试卷习题)考核试卷(A卷)2011-2012学年第2学期(无答案).pdf
- 新乡医学院:《卫生统计学》课程教学资源(课件讲稿,打印版)实验五 统计表与统计图.pdf
- 新乡医学院:《卫生统计学》课程教学资源(教案讲义,打印版)实验五 统计表与统计图.pdf
- 新乡医学院:《卫生统计学》课程教学资源(课件讲稿,打印版)实验四 卡方检验.pdf
- 新乡医学院:《卫生统计学》课程教学资源(教案讲义,打印版)实验四 卡方检验(教师:晁灵).pdf
- 新乡医学院:《卫生统计学》课程教学资源(课件讲稿,打印版)实验三 方差分析实验.pdf
- 新乡医学院:《卫生统计学》课程教学资源(教案讲义,打印版)实验三 方差分析.pdf
- 新乡医学院:《卫生统计学》课程教学资源(课件讲稿,打印版)实验二 总体均数的区间估计假设检验(t检验).pdf
- 同济大学:《应用统计学》课程电子教案(课件讲稿)Chapter 5 The Normal Distribution and Sampling Distributions.ppt
- 《概率论与数理统计》课程教学资源(整理资料)Matlab在统计方面的应用.pdf
- 《概率论与数理统计》课程教学资源(整理资料)正态分布的前世今生.pdf
- 《概率论与数理统计》课程教学资源(PPT讲稿)概率论与数理统计知识点总结.pptx
- 西安电子科技大学:《随机过程概论》课程教学资源(课件讲稿)Chapter 4 随机过程通过线性系统.pdf
- 西安电子科技大学:《随机过程概论》课程教学资源(课件讲稿)Chapter 9 检测理论.pdf
- 沈阳航空航天大学:自动化学院《误差理论及数据处理》课程教学大纲.pdf
- 吉林大学:《医学统计学》课程电子教案(PPT课件)第一章 医学统计中的基本概念、第二章 平均水平(集中趋势)的统计描述(主讲:田迎春).ppt
- 吉林大学:《医学统计学》课程电子教案(PPT课件)第三章 离散趋势的统计描述、第四章 抽样误差与假设检验.ppt
- 吉林大学:《医学统计学》课程电子教案(PPT课件)第五章 t检验、第六章 方差分析、第七章 相对数及其应用.ppt
- 吉林大学:《医学统计学》课程电子教案(PPT课件)第六章 方差分析、第七章 相对数及其应用.ppt
- 吉林大学:《医学统计学》课程电子教案(PPT课件)第八章 卡方检验、第九章 非参数检验方法.ppt
- 吉林大学:《医学统计学》课程电子教案(PPT课件)第十章 线性相关与回归.ppt
- 农业院校《试验设计与分析》课程参考资料(多变量分析方法)DUDE - A User-Friendly Crop Information System.pdf
- 农业院校《试验设计与分析》课程参考资料(多变量分析方法)GGE Biplot vs. AMMI Analysis of Genotype-by-Environment Data.pdf
- 农业院校《试验设计与分析》课程参考资料(多变量分析方法)Logistic模型的参数估计.pdf
- 农业院校《试验设计与分析》课程参考资料(多变量分析方法)Logistic模型配合家禽生长资料参数估计方法比较的MonteCarlo研究.pdf
- 农业院校《试验设计与分析》课程参考资料(多变量分析方法)Logistic模型配合家禽生长资料参数估计方法比较的MonteCarlo研究.pdf
- 农业院校《试验设计与分析》课程参考资料(多变量分析方法)Two Types of GGE Biplots for Analyzing Multi-Environment Trial Data.pdf
- 农业院校《试验设计与分析》课程参考资料(多变量分析方法)典范性状的决策分析.pdf
