Chapter 7 Confidence Interval Estimation
Point Estimate Mini Case:German Tank Problem >Play Game Statistics for Managers Using Microsoft Excel Chap 7-1
Statistics for Managers Using Microsoft Excel Chap 7-1 Point Estimate Mini Case: German Tank Problem Play Game
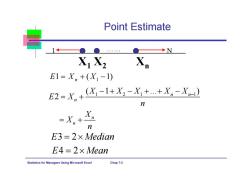
Point Estimate 1←●● ◆N XiX2 E1=Xn+(X1-1) E2=X,+X-l+X,-X++X。-X n n E3=2x Median E4=2×Mean Statistics for Managers Using Microsoft Excel Chap 7-2
Statistics for Managers Using Microsoft Excel Chap 7-2 Point Estimate X 1 X 2 X n 1 N …… 1 1 ( 1) EX X n 1 21 1 ( 1 ... ) 2 n n n n n X XX XX E X n X X n E3 2 Median E4 2 Mean
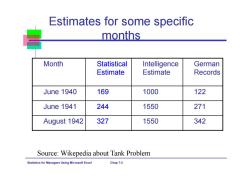
Estimates for some specific months Month Statistical Intelligence German Estimate Estimate Records June 1940 169 1000 122 June 1941 244 1550 271 August 1942 327 1550 342 Source:Wikepedia about Tank Problem Statistics for Managers Using Microsoft Excel Chap 7-3
Statistics for Managers Using Microsoft Excel Chap 7-3 Estimates for some specific months Month Statistical Estimate Intelligence Estimate German Records June 1940 169 1000 122 June 1941 244 1550 271 August 1942 327 1550 342 Source: Wikepedia about Tank Problem

A Mini Case Discussion >We are the maker of the cereal box of 16 ounce.Consumer reports has just published an article that shows that we frequently have less than 15 ounces of cereal in a box. >What should we do? Statistics for Managers Using Microsoft Excel Chap 7-4
Statistics for Managers Using Microsoft Excel Chap 7-4 We are the maker of the cereal box of 16 ounce. Consumer reports has just published an article that shows that we frequently have less than 15 ounces of cereal in a box. What should we do? A Mini Case Discussion
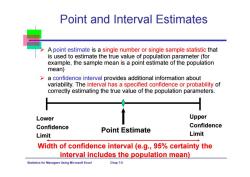
Point and Interval Estimates A point estimate is a single number or single sample statistic that is used to estimate the true value of population parameter(for example,the sample mean is a point estimate of the population mean) a confidence interval provides additional information about variability.The interval has a specified confidence or probability of correctly estimating the true value of the population parameters. Lower Upper Confidence Confidence Point Estimate Limit Limit Width of confidence interval (e.g.,95%certainty the interval includes the population mean) Statistics for Ma agers Using Microsoft Excel Chap 7-5
Statistics for Managers Using Microsoft Excel Chap 7-5 Point and Interval Estimates A point estimate is a single number or single sample statistic that is used to estimate the true value of population parameter (for example, the sample mean is a point estimate of the population mean) a confidence interval provides additional information about variability. The interval has a specified confidence or probability of correctly estimating the true value of the population parameters. Point Estimate Lower Confidence Limit Upper Confidence Limit Width of confidence interval (e.g., 95% certainty the interval includes the population mean)
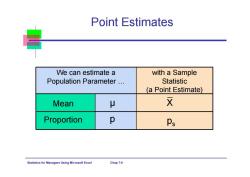
Point Estimates We can estimate a with a Sample Population Parameter... Statistic (a Point Estimate) Mean Proportion p Ps Statistics for Managers Using Microsoft Excel Chap7-6
Statistics for Managers Using Microsoft Excel Chap 7-6 We can estimate a Population Parameter … Point Estimates with a Sample Statistic (a Point Estimate) Mean Proportion p s p μ X
Learning Goals After completing this chapter,you should be able to: >Distinguish between a point estimate and a confidence interval estimate >Construct and interpret a confidence interval estimate for a single population mean using both the Z and t distributions >Form and interpret a confidence interval estimate for a single population proportion >Determine the required sample size to estimate a mean or proportion within a specified margin of error Statistics for Ma agers Using Microsoft Excel Chap7-7
Statistics for Managers Using Microsoft Excel Chap 7-7 Learning Goals After completing this chapter, you should be able to: Distinguish between a point estimate and a confidence interval estimate Construct and interpret a confidence interval estimate for a single population mean using both the Z and t distributions Form and interpret a confidence interval estimate for a single population proportion Determine the required sample size to estimate a mean or proportion within a specified margin of error
Confidence Interval Estimate >An interval gives a range of values: .Takes into consideration variation in sample statistics from sample to sample Based on observation from 1 sample Gives information about closeness to unknown population parameters Stated in terms of level of confidence -Can never be 100%confident Statistics for Mar agers Using Microsoft Excel Chap7-8
Statistics for Managers Using Microsoft Excel Chap 7-8 Confidence Interval Estimate An interval gives a range of values: Takes into consideration variation in sample statistics from sample to sample Based on observation from 1 sample Gives information about closeness to unknown population parameters Stated in terms of level of confidence Can never be 100% confident
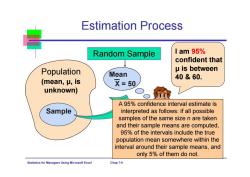
Estimation Process Random Sample I am 95% confident that Population μis between Mean 40&60. (meanμ,is X=50 unknown) A 95%confidence interval estimate is Sample interpreted as follows:if all possible samples of the same size n are taken and their sample means are computed, 95%of the intervals include the true population mean somewhere within the interval around their sample means,and only 5%of them do not. Statistics for Ma nagers Using Microsoft Excel Chap 7-9
Statistics for Managers Using Microsoft Excel Chap 7-9 Estimation Process (mean, μ, is unknown) Population Random Sample Mean X = 50 Sample I am 95% confident that μ is between 40 & 60. A 95% confidence interval estimate is interpreted as follows: if all possible samples of the same size n are taken and their sample means are computed, 95% of the intervals include the true population mean somewhere within the interval around their sample means, and only 5% of them do not
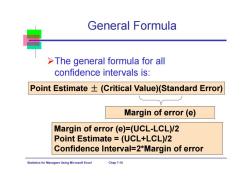
General Formula >The general formula for all confidence intervals is: Point Estimate+(Critical Value)(Standard Error) Margin of error (e) Margin of error(e)=(UCL-LCL)/2 Point Estimate =(UCL+LCL)/2 Confidence Interval=2*Margin of error Statistics for Ma Using Microsoft Excel Chap 7-10
Statistics for Managers Using Microsoft Excel Chap 7-10 General Formula The general formula for all confidence intervals is: Point Estimate ± (Critical Value)(Standard Error) Margin of error (e) Margin of error (e)=(UCL-LCL)/2 Point Estimate = (UCL+LCL)/2 Confidence Interval=2*Margin of error
按次数下载不扣除下载券;
注册用户24小时内重复下载只扣除一次;
顺序:VIP每日次数-->可用次数-->下载券;
- 同济大学:《应用统计学》课程电子教案(课件讲稿)Chapter 6 The Normal Distribution and Other Continuous Distributions.pdf
- 同济大学:《应用统计学》课程电子教案(课件讲稿)Chapter 4 Basic Probability(主讲:王世进).pdf
- 同济大学:《应用统计学》课程电子教案(课件讲稿)Chapter 3 Numerical Descriptive Measures.pdf
- 同济大学:《应用统计学》课程电子教案(课件讲稿)Chapter 2 Presenting Data in Tables and Charts.pdf
- 同济大学:《应用统计学》课程电子教案(课件讲稿)Chapter 1 Introduction and Data Collection(Applied Statistics).pdf
- 同济大学:《应用统计学》课程教学资源(试卷习题)考核试卷(B卷)2011-2012学年第2学期(无答案).pdf
- 同济大学:《应用统计学》课程教学资源(试卷习题)考核试卷(A卷)2011-2012学年第2学期(无答案).pdf
- 新乡医学院:《卫生统计学》课程教学资源(课件讲稿,打印版)实验五 统计表与统计图.pdf
- 新乡医学院:《卫生统计学》课程教学资源(教案讲义,打印版)实验五 统计表与统计图.pdf
- 新乡医学院:《卫生统计学》课程教学资源(课件讲稿,打印版)实验四 卡方检验.pdf
- 新乡医学院:《卫生统计学》课程教学资源(教案讲义,打印版)实验四 卡方检验(教师:晁灵).pdf
- 新乡医学院:《卫生统计学》课程教学资源(课件讲稿,打印版)实验三 方差分析实验.pdf
- 新乡医学院:《卫生统计学》课程教学资源(教案讲义,打印版)实验三 方差分析.pdf
- 新乡医学院:《卫生统计学》课程教学资源(课件讲稿,打印版)实验二 总体均数的区间估计假设检验(t检验).pdf
- 新乡医学院:《卫生统计学》课程教学资源(教案讲义,打印版)实验二 总体均数的区间估计假设检验(t检验).pdf
- 新乡医学院:《卫生统计学》课程教学资源(课件讲稿,打印版)实验一 计算器使用和计量资料描述(定量资料的统计描述).pdf
- 新乡医学院:《卫生统计学》课程教学资源(教案讲义,打印版)实验一 计量资料描述和计算器使用.pdf
- 南京农业大学:《生物统计与试验设计实验》课程教学大纲.pdf
- 南京农业大学:《统计实习》课程教学大纲.pdf
- 《物流经济学》课程电子教案(PPT教学课件讲稿,共十二章).pptx
- 同济大学:《应用统计学》课程电子教案(课件讲稿)Chapter 8 Fundamentals of Hypothesis Testing(One-Sample Tests).pdf
- 同济大学:《应用统计学》课程电子教案(课件讲稿)Chapter 9 Two-Sample Tests with Numerical Data.pdf
- 同济大学:《应用统计学》课程电子教案(课件讲稿)Chapter 10 Analysis of Variance(ANOVA).pdf
- 同济大学:《应用统计学》课程电子教案(课件讲稿)Chapter 11 Simple Linear Regression.pdf
- 同济大学:《应用统计学》课程电子教案(课件讲稿)Chapter 12 Time series based Demand Management.pdf
- 同济大学:《应用统计学》课程电子教案(课件讲稿)Chapter 13 Statistical Applications in Quality Management.pdf
- 同济大学:《应用统计学》课程电子教案(课件讲稿)Chapter 5 The Normal Distribution and Sampling Distributions.ppt
- 《概率论与数理统计》课程教学资源(整理资料)Matlab在统计方面的应用.pdf
- 《概率论与数理统计》课程教学资源(整理资料)正态分布的前世今生.pdf
- 《概率论与数理统计》课程教学资源(PPT讲稿)概率论与数理统计知识点总结.pptx
- 西安电子科技大学:《随机过程概论》课程教学资源(课件讲稿)Chapter 4 随机过程通过线性系统.pdf
- 西安电子科技大学:《随机过程概论》课程教学资源(课件讲稿)Chapter 9 检测理论.pdf
- 沈阳航空航天大学:自动化学院《误差理论及数据处理》课程教学大纲.pdf
- 吉林大学:《医学统计学》课程电子教案(PPT课件)第一章 医学统计中的基本概念、第二章 平均水平(集中趋势)的统计描述(主讲:田迎春).ppt
- 吉林大学:《医学统计学》课程电子教案(PPT课件)第三章 离散趋势的统计描述、第四章 抽样误差与假设检验.ppt
- 吉林大学:《医学统计学》课程电子教案(PPT课件)第五章 t检验、第六章 方差分析、第七章 相对数及其应用.ppt
- 吉林大学:《医学统计学》课程电子教案(PPT课件)第六章 方差分析、第七章 相对数及其应用.ppt
- 吉林大学:《医学统计学》课程电子教案(PPT课件)第八章 卡方检验、第九章 非参数检验方法.ppt
- 吉林大学:《医学统计学》课程电子教案(PPT课件)第十章 线性相关与回归.ppt
- 农业院校《试验设计与分析》课程参考资料(多变量分析方法)DUDE - A User-Friendly Crop Information System.pdf
