同济大学:《应用统计学》课程电子教案(课件讲稿)Chapter 6 The Normal Distribution and Other Continuous Distributions
Statistics for Managers Using Microsoft Excel Chapter 6 The Normal Distribution and Other Continuous Distributions Statistics for Managers Using Microsoft Excel Chap 3-1 Tongji University School of Economics Management
Statistics for Managers Using Microsoft Excel Chap 3-1 Tongji University School of Economics & Management Chapter 6 The Normal Distribution and Other Continuous Distributions Statistics for Managers Using Microsoft Excel
Learning Objectives In this chapter,you will learn: To compute probabilities from the normal distribution >To compute probabilities from the uniform distribution. To compute probabilities from the exponential distribution Statistics for Ma agers Using Microsoft Excel Chap 6-2
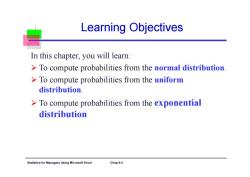
Statistics for Managers Using Microsoft Excel Chap 6-2 Learning Objectives In this chapter, you will learn: To compute probabilities from the normal distribution. To compute probabilities from the uniform distribution. To compute probabilities from the exponential distribution
Probability Distributions Probability Distributions Ch.5 Discrete Continuous Ch.6 Probability Probability Distributions Distributions Binomial Normal Poisson Uniform Hypergeometric Exponential Statistics for Managers Using Microsoft Excel Chap 6-3
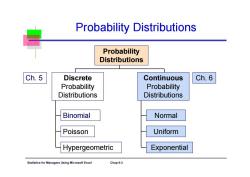
Statistics for Managers Using Microsoft Excel Chap 6-3 Probability Distributions Continuous Probability Distributions Binomial Hypergeometric Poisson Probability Distributions Discrete Probability Distributions Normal Uniform Exponential Ch. 5 Ch. 6
Continuous Probability Distributions >A continuous random variable is a variable that can assume any value on a continuum (can assume an uncountable number of values) ●thickness of an item time required to complete a task o temperature of a solution ●height These can potentially take on any value,depending only on the ability to measure precisely and accurately. Statistics for agers Using Microsoft Excel Chap 6-4
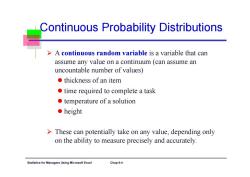
Statistics for Managers Using Microsoft Excel Chap 6-4 Continuous Probability Distributions A continuous random variable is a variable that can assume any value on a continuum (can assume an uncountable number of values) thickness of an item time required to complete a task temperature of a solution height These can potentially take on any value, depending only on the ability to measure precisely and accurately
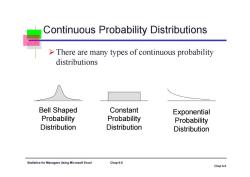
Continuous Probability Distributions >There are many types of continuous probability distributions Bell Shaped Constant Exponential Probability Probability Probability Distribution Distribution Distribution Statistics for Managers Using Microsoft Excel Chap6-5 Chap6-5
Statistics for Managers Using Microsoft Excel Chap 6-5 Continuous Probability Distributions There are many types of continuous probability distributions Chap 6-5 Bell Shaped Probability Distribution Constant Probability Distribution Exponential Probability Distribution
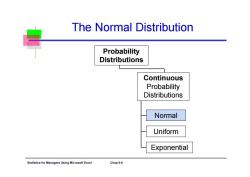
The Normal Distribution Probability Distributions Continuous Probability Distributions Normal Uniform Exponential Statistics for Managers Using Microsoft Exce Chap 6-6
Statistics for Managers Using Microsoft Excel Chap 6-6 The Normal Distribution Probability Distributions Normal Uniform Exponential Continuous Probability Distributions
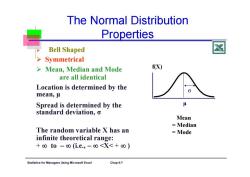
The Normal Distribution Properties Bell Shaped ☒ >Symmetrical > Mean,Median and Mode are all identical Location is determined by the mean,u Spread is determined by the standard deviation,o Mean Median The random variable X has an =Mode infinite theoretical range: +0t0-o(i.e,-o<X<+o) Statistics for Managers Using Microsoft Excel Chap 6-7
Statistics for Managers Using Microsoft Excel Chap 6-7 The Normal Distribution Properties Mean = Median = Mode f(X) μ σ ‘Bell Shaped’ Symmetrical Mean, Median and Mode are all identical Location is determined by the mean, μ Spread is determined by the standard deviation, σ The random variable X has an infinite theoretical range: + to (i.e., <X< + )
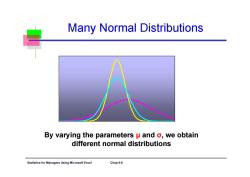
Many Normal Distributions By varying the parameters u and o,we obtain different normal distributions Statistics for Ma Using Microsoft Excel Chap 6-8
Statistics for Managers Using Microsoft Excel Chap 6-8 By varying the parameters μ and σ, we obtain different normal distributions Many Normal Distributions
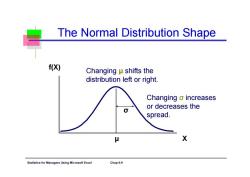
The Normal Distribution Shape f(X) Changingμshifts the distribution left or right. Changing o increases or decreases the spread X Statistics for Managers Using Microsoft Excel Chap 6-9
Statistics for Managers Using Microsoft Excel Chap 6-9 The Normal Distribution Shape Changing μ shifts the distribution left or right. Changing σ increases or decreases the spread. X f(X) μ σ
Probability Density Function >A density curve (or probability density function,PDF)is a graph of a continuous probability distribution.It must satisfy the following properties: The total area under the curve must equal 1 Every point on the curve must have a vertical height that is 0 or greater Statistics for Managers Using Microsoft Excel Chap 6-10
Statistics for Managers Using Microsoft Excel Chap 6-10 Probability Density Function A density curve (or probability density function, PDF) is a graph of a continuous probability distribution. It must satisfy the following properties: The total area under the curve must equal 1 Every point on the curve must have a vertical height that is 0 or greater
按次数下载不扣除下载券;
注册用户24小时内重复下载只扣除一次;
顺序:VIP每日次数-->可用次数-->下载券;
- 同济大学:《应用统计学》课程电子教案(课件讲稿)Chapter 4 Basic Probability(主讲:王世进).pdf
- 同济大学:《应用统计学》课程电子教案(课件讲稿)Chapter 3 Numerical Descriptive Measures.pdf
- 同济大学:《应用统计学》课程电子教案(课件讲稿)Chapter 2 Presenting Data in Tables and Charts.pdf
- 同济大学:《应用统计学》课程电子教案(课件讲稿)Chapter 1 Introduction and Data Collection(Applied Statistics).pdf
- 同济大学:《应用统计学》课程教学资源(试卷习题)考核试卷(B卷)2011-2012学年第2学期(无答案).pdf
- 同济大学:《应用统计学》课程教学资源(试卷习题)考核试卷(A卷)2011-2012学年第2学期(无答案).pdf
- 新乡医学院:《卫生统计学》课程教学资源(课件讲稿,打印版)实验五 统计表与统计图.pdf
- 新乡医学院:《卫生统计学》课程教学资源(教案讲义,打印版)实验五 统计表与统计图.pdf
- 新乡医学院:《卫生统计学》课程教学资源(课件讲稿,打印版)实验四 卡方检验.pdf
- 新乡医学院:《卫生统计学》课程教学资源(教案讲义,打印版)实验四 卡方检验(教师:晁灵).pdf
- 新乡医学院:《卫生统计学》课程教学资源(课件讲稿,打印版)实验三 方差分析实验.pdf
- 新乡医学院:《卫生统计学》课程教学资源(教案讲义,打印版)实验三 方差分析.pdf
- 新乡医学院:《卫生统计学》课程教学资源(课件讲稿,打印版)实验二 总体均数的区间估计假设检验(t检验).pdf
- 新乡医学院:《卫生统计学》课程教学资源(教案讲义,打印版)实验二 总体均数的区间估计假设检验(t检验).pdf
- 新乡医学院:《卫生统计学》课程教学资源(课件讲稿,打印版)实验一 计算器使用和计量资料描述(定量资料的统计描述).pdf
- 新乡医学院:《卫生统计学》课程教学资源(教案讲义,打印版)实验一 计量资料描述和计算器使用.pdf
- 南京农业大学:《生物统计与试验设计实验》课程教学大纲.pdf
- 南京农业大学:《统计实习》课程教学大纲.pdf
- 《物流经济学》课程电子教案(PPT教学课件讲稿,共十二章).pptx
- 中国科学技术大学:《应用时间序列分析》课程教学资源(课件讲稿)第六章 多元时间序列分析.pdf
- Chapter 7 Confidence Interval Estimation.pdf
- 同济大学:《应用统计学》课程电子教案(课件讲稿)Chapter 8 Fundamentals of Hypothesis Testing(One-Sample Tests).pdf
- 同济大学:《应用统计学》课程电子教案(课件讲稿)Chapter 9 Two-Sample Tests with Numerical Data.pdf
- 同济大学:《应用统计学》课程电子教案(课件讲稿)Chapter 10 Analysis of Variance(ANOVA).pdf
- 同济大学:《应用统计学》课程电子教案(课件讲稿)Chapter 11 Simple Linear Regression.pdf
- 同济大学:《应用统计学》课程电子教案(课件讲稿)Chapter 12 Time series based Demand Management.pdf
- 同济大学:《应用统计学》课程电子教案(课件讲稿)Chapter 13 Statistical Applications in Quality Management.pdf
- 同济大学:《应用统计学》课程电子教案(课件讲稿)Chapter 5 The Normal Distribution and Sampling Distributions.ppt
- 《概率论与数理统计》课程教学资源(整理资料)Matlab在统计方面的应用.pdf
- 《概率论与数理统计》课程教学资源(整理资料)正态分布的前世今生.pdf
- 《概率论与数理统计》课程教学资源(PPT讲稿)概率论与数理统计知识点总结.pptx
- 西安电子科技大学:《随机过程概论》课程教学资源(课件讲稿)Chapter 4 随机过程通过线性系统.pdf
- 西安电子科技大学:《随机过程概论》课程教学资源(课件讲稿)Chapter 9 检测理论.pdf
- 沈阳航空航天大学:自动化学院《误差理论及数据处理》课程教学大纲.pdf
- 吉林大学:《医学统计学》课程电子教案(PPT课件)第一章 医学统计中的基本概念、第二章 平均水平(集中趋势)的统计描述(主讲:田迎春).ppt
- 吉林大学:《医学统计学》课程电子教案(PPT课件)第三章 离散趋势的统计描述、第四章 抽样误差与假设检验.ppt
- 吉林大学:《医学统计学》课程电子教案(PPT课件)第五章 t检验、第六章 方差分析、第七章 相对数及其应用.ppt
- 吉林大学:《医学统计学》课程电子教案(PPT课件)第六章 方差分析、第七章 相对数及其应用.ppt
- 吉林大学:《医学统计学》课程电子教案(PPT课件)第八章 卡方检验、第九章 非参数检验方法.ppt
- 吉林大学:《医学统计学》课程电子教案(PPT课件)第十章 线性相关与回归.ppt
