同济大学:《应用统计学》课程电子教案(课件讲稿)Chapter 1 Introduction and Data Collection(Applied Statistics)
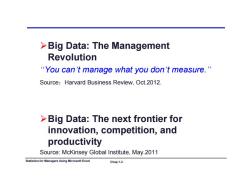
>Big Data:The Management Revolution “You can't manage what you don't measure.” Source:Harvard Business Review,Oct.2012. >Big Data:The next frontier for innovation,competition,and productivity Source:McKinsey Global Institute,May.2011 Statistics for Managers Using Microsoft Excel Chap1-3
Big Data: The Management Big Data: The Management Revolution “You can You can’t manage what you don t manage what you don’t measure t measure.” Source:Harvard Business Review, Oct.2012. Big Data: The next frontier for innovation competition and innovation, competition, and productivity Statistics for Managers Using Microsoft Excel Chap 1-3 Source: McKinsey Global Institute, May.2011
Discussion question: Why Collect Data and How? Statistics for Managers Using Microsoft Excel Chap1-4
Discussion question: Why Collect Data and How? Why Collect Data and How? Statistics for Managers Using Microsoft Excel Chap 1-4
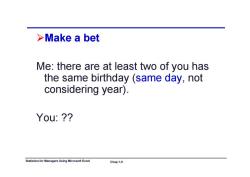
>Make a bet Me:there are at least two of you has the same birthday (same day,not considering year). You:? Statistics for Managers Using Microsoft Excel Chap 1-5
Make a bet Me: there are at least two of you has Me: there are at least two of you has the same birthday (same day, not considering year) considering year). You: ?? Statistics for Managers Using Microsoft Excel Chap 1-5
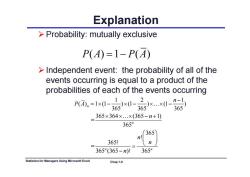
Explanation >Probability:mutually exclusive P(A)=1-P(A) >Independent event:the probability of all of the events occurring is equal to a product of the probabilities of each of the events occurring P团.=lx0-3G5xl-6xXl-36 365×364×.×(365-n+1) 365” 365 3651 n 365"(365-n)! 365m Statistics for Managers Using Microsoft Excel Chap 1-6
Explanation Probability: mutually exclusive Id d t t th b bilit f ll f th PA PA () 1 () Independent event: the probability of all of the events occurring is equal to a product of the prob biliti f h f th t i babilities of each of the events occurring 12 1 ( ) 1 (1 ) (1 ) (1 ) 365 365 365 n n P A 365 365 365 365 364 (365 1) = 365n n 365 ! 365! = ( ) n n n n Statistics for Managers Using Microsoft Excel Chap 1-6 365 (365 )! 365 n n n
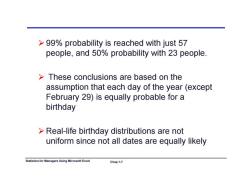
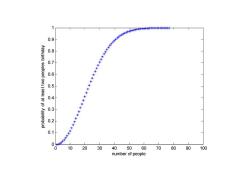
>99%probability is reached with just 57 people,and 50%probability with 23 people These conclusions are based on the assumption that each day of the year (except February 29)is equally probable for a birthday >Real-life birthday distributions are not uniform since not all dates are equally likely Statistics for Managers Using Microsoft Excel Chap 1-7
99% probability is reached with just 57 people, and 50% probability with 23 people. These conclusions are based on the assumption that each day of the year (except assumption that each day of the year (except February 29) is equally probable for a birthday R l ea -lif bi thd di t ib ti t life birthday distributions are not uniform since not all dates are equally likely Statistics for Managers Using Microsoft Excel Chap 1-7
1 米】 0.6 4 0.3 2 0.1 0 10 20 30 40 5060 70 80 90 100 number of people
1 0.9 ay 0.7 0.8 ples birthda 0.5 0.6 t two peop 0 3 0.4 y of at leas 0.2 0.3 probability 0 10 20 30 40 50 60 70 80 90 100 0 0.1 0 10 20 30 40 50 60 70 80 90 100 number of people
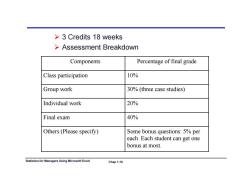
>3 Credits 18 weeks >Assessment Breakdown Components Percentage of final grade Class participation 10% Group work 30%(three case studies) Individual work 20% Final exam 40% Others(Please specify) Some bonus questions:5%per each.Each student can get one bonus at most. Statistics for Managers Using Microsoft Excel Chap 1-10
3 Credits 18 weeks Assessment Breakdown Assessment Breakdown Components Percentage of final grade Class participation 10% Gro p ork Group work 30% (three case st dies) 30% (three case studies) Individual work 20% Final exam 40% Others (Please specify) Some bonus questions: 5% per each. Each student can get one bonus at most. Statistics for Managers Using Microsoft Excel Chap 1-10
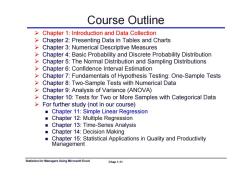
Course Outline >Chapter 1:Introduction and Data Collection Chapter 2:Presenting Data in Tables and Charts >Chapter 3:Numerical Descriptive Measures Chapter 4:Basic Probability and Discrete Probability Distribution >Chapter 5:The Normal Distribution and Sampling Distributions Chapter 6:Confidence Interval Estimation > Chapter 7:Fundamentals of Hypothesis Testing:One-Sample Tests >Chapter 8:Two-Sample Tests with Numerical Data >Chapter 9:Analysis of Variance(ANOVA) >Chapter 10:Tests for Two or More Samples with Categorical Data >For further study(not in our course) Chapter 11:Simple Linear Regression Chapter 12:Multiple Regression ■ Chapter 13:Time-Series Analysis ■ Chapter 14:Decision Making Chapter 15:Statistical Applications in Quality and Productivity Management Statistics for Managers Using Microsoft Excel Chap 1-11
Course Outline Chapter 1: Introduction and Data Collection Chapter 2: Presenting Data in Tables and Charts Chapter 3: Chapter 3: Numerical Descriptive Measures Numerical Descriptive Measures Chapter 4: Basic Probability and Discrete Probability Distribution Chapter 5: The Normal Distribution and Sampling Distributions Chapter 6: Chapter 6: Confidence Interval Estimation Confidence Interval Estimation Chapter 7: Fundamentals of Hypothesis Testing: One-Sample Tests Chapter 8: Two-Sample Tests with Numerical Data Ch t 9 ap ter 9: A l i f V i (ANOVA) Analysis o f Variance (ANOVA) Chapter 10: Tests for Two or More Samples with Categorical Data For further study (not in our course) Chapter 11: Simple Linear Regression Chapter 12: Multiple Regression Chapter 13: Time-Series Analysis Chapter 14: Decision Making Chapter 15: Statistical Applications in Quality and Productivity Management Statistics for Managers Using Microsoft Excel Chap 1-11
Learning Objectives In this chapter, you will learn: . Why statistics is important . How statistics is used in business . The sources of data used in business The types of data used in business The key terms The basics of Microsoft Excel Statistics for Managers Using Microsoft Excel Chap 1-12
Learning Objectives In this chapter, you will learn: Why statistics is important How statistics is used in business Th e sou ces o data used bus ess sou rces of data used in business The types of data used in business Th k t e key terms The basics of Microsoft Excel Statistics for Managers Using Microsoft Excel Chap 1-12
What is Statistics >Statistics:the science of collecting,analyzing, presenting,and interpreting data. Copyright 1994-2000 Encyclopaedia Britannica,Inc. Statistics for Managers Using Microsoft Excel Chap 1-13
What is Statistics Statistics: the science of collecting, analyzing, presenti di i ng, an d interpret ing data . Copyright 1994-2000 Encyclopaedia Britannica, Inc. Statistics for Managers Using Microsoft Excel Chap 1-13
按次数下载不扣除下载券;
注册用户24小时内重复下载只扣除一次;
顺序:VIP每日次数-->可用次数-->下载券;
- 同济大学:《应用统计学》课程教学资源(试卷习题)考核试卷(B卷)2011-2012学年第2学期(无答案).pdf
- 同济大学:《应用统计学》课程教学资源(试卷习题)考核试卷(A卷)2011-2012学年第2学期(无答案).pdf
- 新乡医学院:《卫生统计学》课程教学资源(课件讲稿,打印版)实验五 统计表与统计图.pdf
- 新乡医学院:《卫生统计学》课程教学资源(教案讲义,打印版)实验五 统计表与统计图.pdf
- 新乡医学院:《卫生统计学》课程教学资源(课件讲稿,打印版)实验四 卡方检验.pdf
- 新乡医学院:《卫生统计学》课程教学资源(教案讲义,打印版)实验四 卡方检验(教师:晁灵).pdf
- 新乡医学院:《卫生统计学》课程教学资源(课件讲稿,打印版)实验三 方差分析实验.pdf
- 新乡医学院:《卫生统计学》课程教学资源(教案讲义,打印版)实验三 方差分析.pdf
- 新乡医学院:《卫生统计学》课程教学资源(课件讲稿,打印版)实验二 总体均数的区间估计假设检验(t检验).pdf
- 新乡医学院:《卫生统计学》课程教学资源(教案讲义,打印版)实验二 总体均数的区间估计假设检验(t检验).pdf
- 新乡医学院:《卫生统计学》课程教学资源(课件讲稿,打印版)实验一 计算器使用和计量资料描述(定量资料的统计描述).pdf
- 新乡医学院:《卫生统计学》课程教学资源(教案讲义,打印版)实验一 计量资料描述和计算器使用.pdf
- 南京农业大学:《生物统计与试验设计实验》课程教学大纲.pdf
- 南京农业大学:《统计实习》课程教学大纲.pdf
- 《物流经济学》课程电子教案(PPT教学课件讲稿,共十二章).pptx
- 中国科学技术大学:《应用时间序列分析》课程教学资源(课件讲稿)第六章 多元时间序列分析.pdf
- 中国科学技术大学:《应用时间序列分析》课程教学资源(课件讲稿)第五章 非平稳序列的随机性分析.pdf
- 中国科学技术大学:《应用时间序列分析》课程教学资源(课件讲稿)第四章 非平稳序列的确定性分析.pdf
- 中国科学技术大学:《应用时间序列分析》课程教学资源(课件讲稿)第三章 平稳时间序列分析.pdf
- 中国科学技术大学:《应用时间序列分析》课程教学资源(课件讲稿)第二章 时间序列的预处理.pdf
- 同济大学:《应用统计学》课程电子教案(课件讲稿)Chapter 2 Presenting Data in Tables and Charts.pdf
- 同济大学:《应用统计学》课程电子教案(课件讲稿)Chapter 3 Numerical Descriptive Measures.pdf
- 同济大学:《应用统计学》课程电子教案(课件讲稿)Chapter 4 Basic Probability(主讲:王世进).pdf
- 同济大学:《应用统计学》课程电子教案(课件讲稿)Chapter 6 The Normal Distribution and Other Continuous Distributions.pdf
- Chapter 7 Confidence Interval Estimation.pdf
- 同济大学:《应用统计学》课程电子教案(课件讲稿)Chapter 8 Fundamentals of Hypothesis Testing(One-Sample Tests).pdf
- 同济大学:《应用统计学》课程电子教案(课件讲稿)Chapter 9 Two-Sample Tests with Numerical Data.pdf
- 同济大学:《应用统计学》课程电子教案(课件讲稿)Chapter 10 Analysis of Variance(ANOVA).pdf
- 同济大学:《应用统计学》课程电子教案(课件讲稿)Chapter 11 Simple Linear Regression.pdf
- 同济大学:《应用统计学》课程电子教案(课件讲稿)Chapter 12 Time series based Demand Management.pdf
- 同济大学:《应用统计学》课程电子教案(课件讲稿)Chapter 13 Statistical Applications in Quality Management.pdf
- 同济大学:《应用统计学》课程电子教案(课件讲稿)Chapter 5 The Normal Distribution and Sampling Distributions.ppt
- 《概率论与数理统计》课程教学资源(整理资料)Matlab在统计方面的应用.pdf
- 《概率论与数理统计》课程教学资源(整理资料)正态分布的前世今生.pdf
- 《概率论与数理统计》课程教学资源(PPT讲稿)概率论与数理统计知识点总结.pptx
- 西安电子科技大学:《随机过程概论》课程教学资源(课件讲稿)Chapter 4 随机过程通过线性系统.pdf
- 西安电子科技大学:《随机过程概论》课程教学资源(课件讲稿)Chapter 9 检测理论.pdf
- 沈阳航空航天大学:自动化学院《误差理论及数据处理》课程教学大纲.pdf
- 吉林大学:《医学统计学》课程电子教案(PPT课件)第一章 医学统计中的基本概念、第二章 平均水平(集中趋势)的统计描述(主讲:田迎春).ppt
- 吉林大学:《医学统计学》课程电子教案(PPT课件)第三章 离散趋势的统计描述、第四章 抽样误差与假设检验.ppt
