同济大学:《应用统计学》课程电子教案(课件讲稿)Chapter 8 Fundamentals of Hypothesis Testing(One-Sample Tests)
Statistics for Managers Using Microsoft Excel Chapter 8 Fundamentals of Hypothesis Testing:One-Sample Tests Statistics for Managers Using Microsoft Excel Chap 8-1
Statistics for Managers Using Microsoft Excel Chap 8-1 Chapter 8 Fundamentals of Hypothesis Testing: One-Sample Tests Statistics for Managers Using Microsoft Excel
Learning Goals After completing this chapter,you should be able to: Formulate null(Ho)and alternative hypotheses (H1)for applications involving one sample population mean or proportion Formulate a decision rule for testing a hypothesis Know how to use the critical value and p-value approaches to test the null hypothesis(for both mean and proportion problems) Know what Type I and Type ll errors are Statistics for Ma agers Using Microsoft Excel Chap 8-2
Statistics for Managers Using Microsoft Excel Chap 8-2 Learning Goals After completing this chapter, you should be able to: Formulate null (H0) and alternative hypotheses (H1) for applications involving one sample population mean or proportion Formulate a decision rule for testing a hypothesis Know how to use the critical value and p-value approaches to test the null hypothesis (for both mean and proportion problems) Know what Type I and Type II errors are
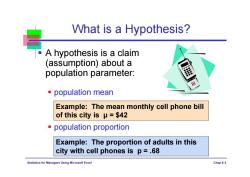
What is a Hypothesis? A hypothesis is a claim (assumption)about a population parameter: population mean Example:The mean monthly cell phone bill of this city isμ=$42 population proportion Example:The proportion of adults in this city with cell phones is p=.68 Statistics for Ma Using Microsoft Excel Chap8-3
Statistics for Managers Using Microsoft Excel Chap 8-3 What is a Hypothesis? A hypothesis is a claim (assumption) about a population parameter: population mean population proportion Example: The mean monthly cell phone bill of this city is μ = $42 Example: The proportion of adults in this city with cell phones is p = .68
What is Hypothesis testing? A step-by-step methodology that enables one to make inferences about a population parameter by analyzing differences between the results observed (the sample statistic)and the results one is expected to obtain if some underlying hypothesis is actually true. For example,is the mean weight of the cereal boxes produced at a company consistent with what would be expected if the mean of the entire population of cereal boxes is 368 grams?Or,can you infer that the population mean is not equal to 368 grams because the sample mean is significantly different from 368 grams Statistics Using Microsoft Excel Chap 8-4
Statistics for Managers Using Microsoft Excel Chap 8-4 What is Hypothesis testing? A step-by-step methodology that enables one to make inferences about a population parameter by analyzing differences between the results observed (the sample statistic) and the results one is expected to obtain if some underlying hypothesis is actually true. For example, is the mean weight of the cereal boxes produced at a company consistent with what would be expected if the mean of the entire population of cereal boxes is 368 grams? Or, can you infer that the population mean is not equal to 368 grams because the sample mean is significantly different from 368 grams
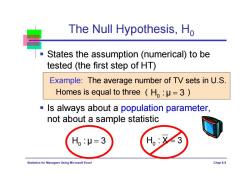
The Null Hypothesis,Ho States the assumption(numerical)to be tested (the first step of HT) Example:The average number of TV sets in U.S. Homes is equal to three(H,:μ=3) Is always about a population parameter, not about a sample statistic H:μ=3 H岁 3 Statistics for Mar agers Using Microsoft Excel Chap8-5
Statistics for Managers Using Microsoft Excel Chap 8-5 The Null Hypothesis, H0 H0 :μ 3 H0 :μ 3 H0 : X 3 States the assumption (numerical) to be tested (the first step of HT) Example: The average number of TV sets in U.S. Homes is equal to three ( ) Is always about a population parameter, not about a sample statistic
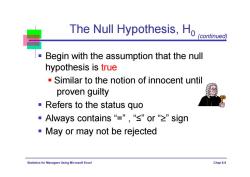
The Null Hypothesis,Ho continued) Begin with the assumption that the null hypothesis is true Similar to the notion of innocent until proven guilty Refers to the status quo "Always contains“=”,“≤”or“≥”sign May or may not be rejected Statistics for Ma agers Using Microsoft Excel Chap 8-6
Statistics for Managers Using Microsoft Excel Chap 8-6 The Null Hypothesis, H0 Begin with the assumption that the null hypothesis is true Similar to the notion of innocent until proven guilty Refers to the status quo Always contains “=” , “≤” or “” sign May or may not be rejected (continued)
The Alternative Hypothesis,H1 Is the opposite of the null hypothesis e.g.,The average number of TV sets in U.S. homes is not equal to3(H1:μ≠3) Challenges the status quo ·Never contains the“="”,“≤”or"≥”sign May or may not be proven Is generally the hypothesis that the researcher is trying to prove Statistics for Mar agers Using Microsoft Excel Chap 8-7
Statistics for Managers Using Microsoft Excel Chap 8-7 The Alternative Hypothesis, H1 Is the opposite of the null hypothesis e.g., The average number of TV sets in U.S. homes is not equal to 3 ( H1: μ ≠ 3 ) Challenges the status quo Never contains the “=” , “≤” or “” sign May or may not be proven Is generally the hypothesis that the researcher is trying to prove
A Summary of the Null and Alternative Hypothesis The Null Hypothesis Ho,is the hypothesis that is always tested. The Alternative Hypothesis,H1,is set up as the opposite of the null hypothesis and represents the conclusion supported if the null hypothesis is rejected The Null Hypothesis always refers to a specified value of the population parameter (such as u),not to a sample statistic (such as X) Statistics for agers Using Microsoft Excel Chap 8-8
Statistics for Managers Using Microsoft Excel Chap 8-8 A Summary of the Null and Alternative Hypothesis The Null Hypothesis H0, is the hypothesis that is always tested. The Alternative Hypothesis, H1, is set up as the opposite of the null hypothesis and represents the conclusion supported if the null hypothesis is rejected The Null Hypothesis always refers to a specified value of the population parameter (such as u), not to a sample statistic (such as ) X
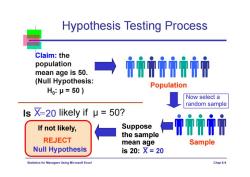
Hypothesis Testing Process Claim:the population mean age is 50. (Null Hypothesis: Population H0:μ=50) Now select a random sample Is X-20 likely if u 50? If not likely, Suppose 亦亦7 the sample REJECT mean age Sample Null Hypothesis is20:X=20 Statistics for Managers Using Microsoft Excel Chap8-9
Statistics for Managers Using Microsoft Excel Chap 8-9 Population Claim: the population mean age is 50. (Null Hypothesis: REJECT Suppose the sample mean age is 20: X = 20 Sample Null Hypothesis Is 20 likely if μ = 50? Hypothesis Testing Process If not likely, Now select a random sample H0: μ = 50 ) X
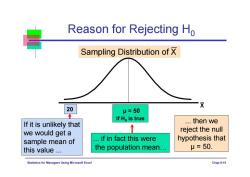
Reason for Rejecting Ho Sampling Distribution of X 20 μ=50 If Ho is true If it is unlikely that ..then we we would get a ↑ reject the null sample mean of if in fact this were hypothesis that this value... the population mean... μ=50. Statistics for Ma agers Using Microsoft Excel Chap 8-10
Statistics for Managers Using Microsoft Excel Chap 8-10 Sampling Distribution of X μ = 50 If H0 is true If it is unlikely that we would get a sample mean of this value ... ... then we reject the null hypothesis that μ = 50. Reason for Rejecting H0 20 ... if in fact this were the population mean… X
按次数下载不扣除下载券;
注册用户24小时内重复下载只扣除一次;
顺序:VIP每日次数-->可用次数-->下载券;
- Chapter 7 Confidence Interval Estimation.pdf
- 同济大学:《应用统计学》课程电子教案(课件讲稿)Chapter 6 The Normal Distribution and Other Continuous Distributions.pdf
- 同济大学:《应用统计学》课程电子教案(课件讲稿)Chapter 4 Basic Probability(主讲:王世进).pdf
- 同济大学:《应用统计学》课程电子教案(课件讲稿)Chapter 3 Numerical Descriptive Measures.pdf
- 同济大学:《应用统计学》课程电子教案(课件讲稿)Chapter 2 Presenting Data in Tables and Charts.pdf
- 同济大学:《应用统计学》课程电子教案(课件讲稿)Chapter 1 Introduction and Data Collection(Applied Statistics).pdf
- 同济大学:《应用统计学》课程教学资源(试卷习题)考核试卷(B卷)2011-2012学年第2学期(无答案).pdf
- 同济大学:《应用统计学》课程教学资源(试卷习题)考核试卷(A卷)2011-2012学年第2学期(无答案).pdf
- 新乡医学院:《卫生统计学》课程教学资源(课件讲稿,打印版)实验五 统计表与统计图.pdf
- 新乡医学院:《卫生统计学》课程教学资源(教案讲义,打印版)实验五 统计表与统计图.pdf
- 新乡医学院:《卫生统计学》课程教学资源(课件讲稿,打印版)实验四 卡方检验.pdf
- 新乡医学院:《卫生统计学》课程教学资源(教案讲义,打印版)实验四 卡方检验(教师:晁灵).pdf
- 新乡医学院:《卫生统计学》课程教学资源(课件讲稿,打印版)实验三 方差分析实验.pdf
- 新乡医学院:《卫生统计学》课程教学资源(教案讲义,打印版)实验三 方差分析.pdf
- 新乡医学院:《卫生统计学》课程教学资源(课件讲稿,打印版)实验二 总体均数的区间估计假设检验(t检验).pdf
- 新乡医学院:《卫生统计学》课程教学资源(教案讲义,打印版)实验二 总体均数的区间估计假设检验(t检验).pdf
- 新乡医学院:《卫生统计学》课程教学资源(课件讲稿,打印版)实验一 计算器使用和计量资料描述(定量资料的统计描述).pdf
- 新乡医学院:《卫生统计学》课程教学资源(教案讲义,打印版)实验一 计量资料描述和计算器使用.pdf
- 南京农业大学:《生物统计与试验设计实验》课程教学大纲.pdf
- 南京农业大学:《统计实习》课程教学大纲.pdf
- 同济大学:《应用统计学》课程电子教案(课件讲稿)Chapter 9 Two-Sample Tests with Numerical Data.pdf
- 同济大学:《应用统计学》课程电子教案(课件讲稿)Chapter 10 Analysis of Variance(ANOVA).pdf
- 同济大学:《应用统计学》课程电子教案(课件讲稿)Chapter 11 Simple Linear Regression.pdf
- 同济大学:《应用统计学》课程电子教案(课件讲稿)Chapter 12 Time series based Demand Management.pdf
- 同济大学:《应用统计学》课程电子教案(课件讲稿)Chapter 13 Statistical Applications in Quality Management.pdf
- 同济大学:《应用统计学》课程电子教案(课件讲稿)Chapter 5 The Normal Distribution and Sampling Distributions.ppt
- 《概率论与数理统计》课程教学资源(整理资料)Matlab在统计方面的应用.pdf
- 《概率论与数理统计》课程教学资源(整理资料)正态分布的前世今生.pdf
- 《概率论与数理统计》课程教学资源(PPT讲稿)概率论与数理统计知识点总结.pptx
- 西安电子科技大学:《随机过程概论》课程教学资源(课件讲稿)Chapter 4 随机过程通过线性系统.pdf
- 西安电子科技大学:《随机过程概论》课程教学资源(课件讲稿)Chapter 9 检测理论.pdf
- 沈阳航空航天大学:自动化学院《误差理论及数据处理》课程教学大纲.pdf
- 吉林大学:《医学统计学》课程电子教案(PPT课件)第一章 医学统计中的基本概念、第二章 平均水平(集中趋势)的统计描述(主讲:田迎春).ppt
- 吉林大学:《医学统计学》课程电子教案(PPT课件)第三章 离散趋势的统计描述、第四章 抽样误差与假设检验.ppt
- 吉林大学:《医学统计学》课程电子教案(PPT课件)第五章 t检验、第六章 方差分析、第七章 相对数及其应用.ppt
- 吉林大学:《医学统计学》课程电子教案(PPT课件)第六章 方差分析、第七章 相对数及其应用.ppt
- 吉林大学:《医学统计学》课程电子教案(PPT课件)第八章 卡方检验、第九章 非参数检验方法.ppt
- 吉林大学:《医学统计学》课程电子教案(PPT课件)第十章 线性相关与回归.ppt
- 农业院校《试验设计与分析》课程参考资料(多变量分析方法)DUDE - A User-Friendly Crop Information System.pdf
- 农业院校《试验设计与分析》课程参考资料(多变量分析方法)GGE Biplot vs. AMMI Analysis of Genotype-by-Environment Data.pdf
