同济大学:《应用统计学》课程电子教案(课件讲稿)Chapter 3 Numerical Descriptive Measures
Statistics for Managers using Microsoft®E Excel Chapter 3 Numerical Descriptive Measures Statistics for Ma nagers Using Microsoft Excel Chap 3-1
Statistics for Managers Using Microsoft Excel Chap 3-1 Statistics for Managers using Microsoft® Excel Chapter 3 Numerical Descriptive Measures
Learning Objectives In this chapter,you will learn: >To describe the properties of central tendency, variation and shape in numerical data To calculate descriptive summary measures for a population To construct and interpret a box-and-whisker plot >To describe the covariance and coefficient of correlation as a measure of the strength of the relationship between two numerical variables Statistics for Managers Using Microsoft Excel Chap 3-2
Statistics for Managers Using Microsoft Excel Chap 3-2 Learning Objectives In this chapter, you will learn: To describe the properties of central tendency, variation and shape in numerical data To calculate descriptive summary measures for a population To construct and interpret a box-and-whisker plot To describe the covariance and coefficient of correlation as a measure of the strength of the relationship between two numerical variables
Summary Definitions >The central tendency is the extent to which all the data values group around a typical or central value. >The variation is the amount of dispersion,or scattering,of values >The shape is the pattern of the distribution of values from the lowest value to the highest value. Statistics for Ma nagers Using Microsoft Excel Chap 3-3
Statistics for Managers Using Microsoft Excel Chap 3-3 Summary Definitions The central tendency is the extent to which all the data values group around a typical or central value. The variation is the amount of dispersion, or scattering, of values The shape is the pattern of the distribution of values from the lowest value to the highest value
Chapter Topics Measures of central tendency Mean,median,mode,geometric mean ■Quartile ■Measure of variation Range,interquartile range,variance and standard deviation,coefficient of variation Shape Symmetric,skewed,using box-and-whisker plots Covariance and Coefficient of correlation Statistics for Mar nagers Using Microsoft Excel Chap 3-4
Statistics for Managers Using Microsoft Excel Chap 3-4 Chapter Topics Measures of central tendency Mean, median, mode, geometric mean Quartile Measure of variation Range, interquartile range, variance and standard deviation, coefficient of variation Shape Symmetric, skewed, using box-and-whisker plots Covariance and Coefficient of correlation
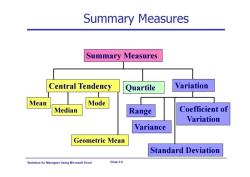
Summary Measures Summary Measures Central Tendency Quartile Variation Mean Mode Median Range Coefficient of Variation Variance Geometric Mean Standard Deviation Statistics for Ma nagers Using Microsoft Excel Chap 3-5
Statistics for Managers Using Microsoft Excel Chap 3-5 Summary Measures Central Tendency Mean Median Mode Quartile Geometric Mean Summary Measures Variation Variance Standard Deviation Coefficient of Variation Range
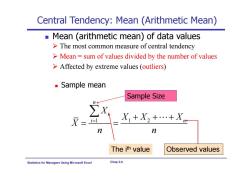
Central Tendency:Mean (Arithmetic Mean) Mean (arithmetic mean)of data values The most common measure of central tendency >Mean sum of values divided by the number of values Affected by extreme values (outliers) Sample mean Sample Size i= X1+X2+…+Xx The ith value Observed values Statistics for Managers Using Microsoft Excel Chap 3-6
Statistics for Managers Using Microsoft Excel Chap 3-6 Central Tendency: Mean (Arithmetic Mean) Mean (arithmetic mean) of data values Sample mean 1 12 n i i n X X X X X n n Sample Size The most common measure of central tendency Mean = sum of values divided by the number of values Affected by extreme values (outliers) The i Observed values th value
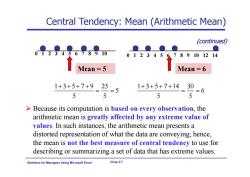
Central Tendency:Mean (Arithmetic Mean) A号w (continued) ●● 012345(789101214 Mean=5 Mean=6 1+3+5+7+925 J 5 1+3+5+7+1430 U =6 5 5 >Because its computation is based on every observation,the arithmetic mean is greatly affected by any extreme value of values.In such instances,the arithmetic mean presents a distorted representation of what the data are conveying;hence, the mean is not the best measure of central tendency to use for describing or summarizing a set of data that has extreme values. Statistics for Managers Using Microsoft Excel Chap 3-7
Statistics for Managers Using Microsoft Excel Chap 3-7 Central Tendency: Mean (Arithmetic Mean) (continued) 0 1 2 3 4 5 6 7 8 9 10 0 1 2 3 4 5 6 7 8 9 10 12 14 Mean = 5 Mean = 6 5 5 25 5 1 3 5 7 9 6 5 30 5 1 3 5 7 14 Because its computation is based on every observation, the arithmetic mean is greatly affected by any extreme value of values. In such instances, the arithmetic mean presents a distorted representation of what the data are conveying; hence, the mean is not the best measure of central tendency to use for describing or summarizing a set of data that has extreme values
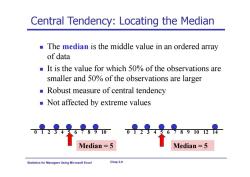
Central Tendency:Locating the Median The median is the middle value in an ordered array of data It is the value for which 50%of the observations are smaller and 50%of the observations are larger Robust measure of central tendency Not affected by extreme values 891012 Median=5 Median =5 Statistics for Ma agers Using Microsoft Excel Chap 3-8
Statistics for Managers Using Microsoft Excel Chap 3-8 Central Tendency: Locating the Median The median is the middle value in an ordered array of data It is the value for which 50% of the observations are smaller and 50% of the observations are larger Robust measure of central tendency Not affected by extreme values 0 1 2 3 4 5 6 7 8 9 10 0 1 2 3 4 5 6 7 8 9 10 12 14 Median = 5 Median = 5
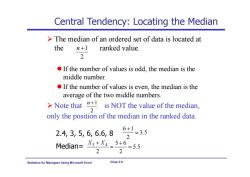
Central Tendency:Locating the Median >The median of an ordered set of data is located at the n+1 ranked value. 2 If the number of values is odd,the median is the middle number. If the number of values is even,the median is the average of the two middle numbers. >Note that+is NOT the value of the median, only the position of the median in the ranked data. 2.4,3,5,6,6.6,8 6+1 2 =35 Median=X3+X5+6 =5.5 2 2 Statistics Using Microsoft Excel Chap 3-9
Statistics for Managers Using Microsoft Excel Chap 3-9 Central Tendency: Locating the Median The median of an ordered set of data is located at the ranked value. If the number of values is odd, the median is the middle number. If the number of values is even, the median is the average of the two middle numbers. Note that is NOT the value of the median, only the position of the median in the ranked data. 2 n 1 2 n 1 2.4, 3, 5, 6, 6.6, 8 Median= 3.5 2 6 1 5.5 2 5 6 2 3 4 X X
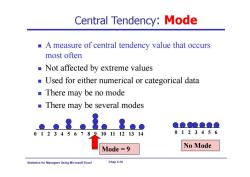
Central Tendency:Mode A measure of central tendency value that occurs most often Not affected by extreme values Used for either numerical or categorical data ■There may be no mode There may be several modes ●●●●Q 012345678910 11121314 0123456 Mode=9 No Mode Statistics for Managers Using Microsoft Excel Chap 3-10
Statistics for Managers Using Microsoft Excel Chap 3-10 Central Tendency: Mode A measure of central tendency value that occurs most often Not affected by extreme values Used for either numerical or categorical data There may be no mode There may be several modes 0 1 2 3 4 5 6 7 8 9 10 11 12 13 14 Mode = 9 0 1 2 3 4 5 6 No Mode
按次数下载不扣除下载券;
注册用户24小时内重复下载只扣除一次;
顺序:VIP每日次数-->可用次数-->下载券;
- 同济大学:《应用统计学》课程电子教案(课件讲稿)Chapter 2 Presenting Data in Tables and Charts.pdf
- 同济大学:《应用统计学》课程电子教案(课件讲稿)Chapter 1 Introduction and Data Collection(Applied Statistics).pdf
- 同济大学:《应用统计学》课程教学资源(试卷习题)考核试卷(B卷)2011-2012学年第2学期(无答案).pdf
- 同济大学:《应用统计学》课程教学资源(试卷习题)考核试卷(A卷)2011-2012学年第2学期(无答案).pdf
- 新乡医学院:《卫生统计学》课程教学资源(课件讲稿,打印版)实验五 统计表与统计图.pdf
- 新乡医学院:《卫生统计学》课程教学资源(教案讲义,打印版)实验五 统计表与统计图.pdf
- 新乡医学院:《卫生统计学》课程教学资源(课件讲稿,打印版)实验四 卡方检验.pdf
- 新乡医学院:《卫生统计学》课程教学资源(教案讲义,打印版)实验四 卡方检验(教师:晁灵).pdf
- 新乡医学院:《卫生统计学》课程教学资源(课件讲稿,打印版)实验三 方差分析实验.pdf
- 新乡医学院:《卫生统计学》课程教学资源(教案讲义,打印版)实验三 方差分析.pdf
- 新乡医学院:《卫生统计学》课程教学资源(课件讲稿,打印版)实验二 总体均数的区间估计假设检验(t检验).pdf
- 新乡医学院:《卫生统计学》课程教学资源(教案讲义,打印版)实验二 总体均数的区间估计假设检验(t检验).pdf
- 新乡医学院:《卫生统计学》课程教学资源(课件讲稿,打印版)实验一 计算器使用和计量资料描述(定量资料的统计描述).pdf
- 新乡医学院:《卫生统计学》课程教学资源(教案讲义,打印版)实验一 计量资料描述和计算器使用.pdf
- 南京农业大学:《生物统计与试验设计实验》课程教学大纲.pdf
- 南京农业大学:《统计实习》课程教学大纲.pdf
- 《物流经济学》课程电子教案(PPT教学课件讲稿,共十二章).pptx
- 中国科学技术大学:《应用时间序列分析》课程教学资源(课件讲稿)第六章 多元时间序列分析.pdf
- 中国科学技术大学:《应用时间序列分析》课程教学资源(课件讲稿)第五章 非平稳序列的随机性分析.pdf
- 中国科学技术大学:《应用时间序列分析》课程教学资源(课件讲稿)第四章 非平稳序列的确定性分析.pdf
- 同济大学:《应用统计学》课程电子教案(课件讲稿)Chapter 4 Basic Probability(主讲:王世进).pdf
- 同济大学:《应用统计学》课程电子教案(课件讲稿)Chapter 6 The Normal Distribution and Other Continuous Distributions.pdf
- Chapter 7 Confidence Interval Estimation.pdf
- 同济大学:《应用统计学》课程电子教案(课件讲稿)Chapter 8 Fundamentals of Hypothesis Testing(One-Sample Tests).pdf
- 同济大学:《应用统计学》课程电子教案(课件讲稿)Chapter 9 Two-Sample Tests with Numerical Data.pdf
- 同济大学:《应用统计学》课程电子教案(课件讲稿)Chapter 10 Analysis of Variance(ANOVA).pdf
- 同济大学:《应用统计学》课程电子教案(课件讲稿)Chapter 11 Simple Linear Regression.pdf
- 同济大学:《应用统计学》课程电子教案(课件讲稿)Chapter 12 Time series based Demand Management.pdf
- 同济大学:《应用统计学》课程电子教案(课件讲稿)Chapter 13 Statistical Applications in Quality Management.pdf
- 同济大学:《应用统计学》课程电子教案(课件讲稿)Chapter 5 The Normal Distribution and Sampling Distributions.ppt
- 《概率论与数理统计》课程教学资源(整理资料)Matlab在统计方面的应用.pdf
- 《概率论与数理统计》课程教学资源(整理资料)正态分布的前世今生.pdf
- 《概率论与数理统计》课程教学资源(PPT讲稿)概率论与数理统计知识点总结.pptx
- 西安电子科技大学:《随机过程概论》课程教学资源(课件讲稿)Chapter 4 随机过程通过线性系统.pdf
- 西安电子科技大学:《随机过程概论》课程教学资源(课件讲稿)Chapter 9 检测理论.pdf
- 沈阳航空航天大学:自动化学院《误差理论及数据处理》课程教学大纲.pdf
- 吉林大学:《医学统计学》课程电子教案(PPT课件)第一章 医学统计中的基本概念、第二章 平均水平(集中趋势)的统计描述(主讲:田迎春).ppt
- 吉林大学:《医学统计学》课程电子教案(PPT课件)第三章 离散趋势的统计描述、第四章 抽样误差与假设检验.ppt
- 吉林大学:《医学统计学》课程电子教案(PPT课件)第五章 t检验、第六章 方差分析、第七章 相对数及其应用.ppt
- 吉林大学:《医学统计学》课程电子教案(PPT课件)第六章 方差分析、第七章 相对数及其应用.ppt
