同济大学:《应用统计学》课程电子教案(课件讲稿)Chapter 9 Two-Sample Tests with Numerical Data
Statistics for Managers Using Microsoft Excel Chapter 9 Two-Sample Tests Statistics for Managers Using Microsoft Excel Chap 9-1
Statistics for Managers Using Microsoft Excel Chap 9-1 Chapter 9 Two-Sample Tests Statistics for Managers Using Microsoft Excel
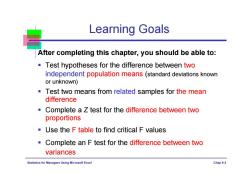
Learning Goals After completing this chapter,you should be able to: Test hypotheses for the difference between two independent population means(standard deviations known or unknown) Test two means from related samples for the mean difference Complete a Z test for the difference between two proportions Use the F table to find critical F values Complete an F test for the difference between two variances Statistics for Managers Using Microsoft Excel Chap9-2
Statistics for Managers Using Microsoft Excel Chap 9-2 Learning Goals After completing this chapter, you should be able to: Test hypotheses for the difference between two independent population means (standard deviations known or unknown) Test two means from related samples for the mean difference Complete a Z test for the difference between two proportions Use the F table to find critical F values Complete an F test for the difference between two variances

One sample test Hypothesis Hypothesis Tests for P Tests for u nP≥5 o Known o Unknown and n-nP≥5 Statistics for Ma nagers Using Microsoft Excel Chap 9-3
Statistics for Managers Using Microsoft Excel Chap 9-3 One sample test Known Unknown Hypothesis Tests for nP 5 and n-nP 5 Hypothesis Tests for P
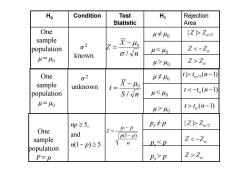
Ho Condition Test H Rejection Statistic Area One u丰0 IZZan sample X-40 population 02 oln u0 ZzLa One 02 u≠o t>ta/2(n-1) sample unknown t= 又- population SIn u40 t>i(n-1) hp≥5, P,卡p IZZan One Z= ps-p and sample p1-p) 卫.Za
n X Z / 0 μ ≠ μ 0 μ > μ 0 μ μ 0 μ p / 2 | | Z Z Z Z Z Z One sample population P = p ( 1 ) 5 and 5, n p np n p p p p Z s ( 1 ) ps < p ps ≠ p
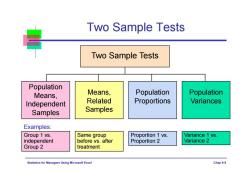
Two Sample Tests Two Sample Tests Population Means, Means, Population Population Independent Related Proportions Variances Samples Samples Examples: Group 1 vs. Same group Proportion 1 vs. Variance 1 vs. independent before vs.after Proportion 2 Variance 2 Group 2 treatment Statistics for Ma agers Using Microsoft Excel Chap 9-5
Statistics for Managers Using Microsoft Excel Chap 9-5 Two Sample Tests Two Sample Tests Population Means, Independent Samples Means, Related Samples Population Variances Group 1 vs. independent Group 2 Same group before vs. after treatment Variance 1 vs. Variance 2 Examples: Population Proportions Proportion 1 vs. Proportion 2
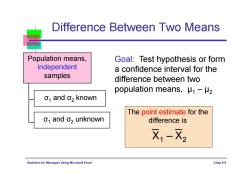
Difference Between Two Means Population means, Goal:Test hypothesis or form independent a confidence interval for the samples difference between two population means,.μ1-μ2 o1 and o2 known The point estimate for the o,and o2 unknown difference is X1-X2 Statistics for Managers Using Microsoft Excel Chap9-6
Statistics for Managers Using Microsoft Excel Chap 9-6 Difference Between Two Means Population means, independent samples σ1 and σ2 known σ1 and σ2 unknown Goal: Test hypothesis or form a confidence interval for the difference between two population means, μ1 – μ2 The point estimate for the difference is X1 – X2
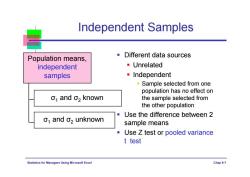
Independent Samples Population means, Different data sources independent Unrelated samples ·Independent -Sample selected from one population has no effect on o1 and o2 known the sample selected from the other population Use the difference between 2 o1 and o2 unknown sample means Use Z test or pooled variance t test Statistics for Managers Using Microsoft Excel Chap9-7
Statistics for Managers Using Microsoft Excel Chap 9-7 Independent Samples Population means, independent samples Different data sources Unrelated Independent Sample selected from one population has no effect on the sample selected from the other population Use the difference between 2 sample means Use Z test or pooled variance t test σ1 and σ2 known σ1 and σ2 unknown
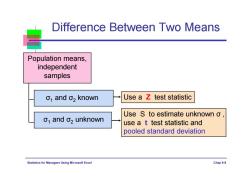
Difference Between Two Means Population means, independent samples o and 02 known Use a z test statistic Use S to estimate unknown o, o,and o2 unknown use a t test statistic and pooled standard deviation Statistics for Managers Using Microsoft Excel Chap9-8
Statistics for Managers Using Microsoft Excel Chap 9-8 Difference Between Two Means Population means, independent samples σ1 and σ2 known σ1 and σ2 unknown Use a Z test statistic Use S to estimate unknown σ , use a t test statistic and pooled standard deviation
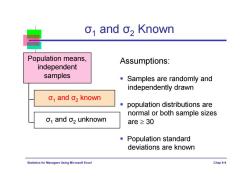
o,and o,Known Population means, Assumptions: independent samples Samples are randomly and independently drawn o and 02 known population distributions are normal or both sample sizes o1 and o2 unknown are≥30 Population standard deviations are known Statistics for Managers Using Microsoft Excel Chap9-9
Statistics for Managers Using Microsoft Excel Chap 9-9 Population means, independent samples σ1 and σ2 known σ1 and σ2 Known Assumptions: Samples are randomly and independently drawn population distributions are normal or both sample sizes are 30 Population standard deviations are known σ1 and σ2 unknown
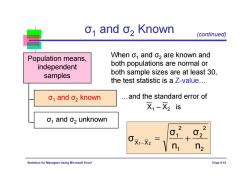
o,and o,Known (continued) Population means, When o,and o2 are known and independent both populations are normal or samples both sample sizes are at least 30, the test statistic is a Z-value... o and 02 known ..and the standard error of 又1-又2is o1 and o2 unknown 2 62 0x1-X2 n n2 Statistics for Managers Using Microsoft Excel Chap 9-10
Statistics for Managers Using Microsoft Excel Chap 9-10 Population means, independent samples σ1 and σ2 known …and the standard error of X1 – X2 is When σ1 and σ2 are known and both populations are normal or both sample sizes are at least 30, the test statistic is a Z-value… 2 2 2 1 2 1 X X n σ n σ σ 1 2 σ1 (continued) and σ2 Known σ1 and σ2 unknown
按次数下载不扣除下载券;
注册用户24小时内重复下载只扣除一次;
顺序:VIP每日次数-->可用次数-->下载券;
- 同济大学:《应用统计学》课程电子教案(课件讲稿)Chapter 8 Fundamentals of Hypothesis Testing(One-Sample Tests).pdf
- Chapter 7 Confidence Interval Estimation.pdf
- 同济大学:《应用统计学》课程电子教案(课件讲稿)Chapter 6 The Normal Distribution and Other Continuous Distributions.pdf
- 同济大学:《应用统计学》课程电子教案(课件讲稿)Chapter 4 Basic Probability(主讲:王世进).pdf
- 同济大学:《应用统计学》课程电子教案(课件讲稿)Chapter 3 Numerical Descriptive Measures.pdf
- 同济大学:《应用统计学》课程电子教案(课件讲稿)Chapter 2 Presenting Data in Tables and Charts.pdf
- 同济大学:《应用统计学》课程电子教案(课件讲稿)Chapter 1 Introduction and Data Collection(Applied Statistics).pdf
- 同济大学:《应用统计学》课程教学资源(试卷习题)考核试卷(B卷)2011-2012学年第2学期(无答案).pdf
- 同济大学:《应用统计学》课程教学资源(试卷习题)考核试卷(A卷)2011-2012学年第2学期(无答案).pdf
- 新乡医学院:《卫生统计学》课程教学资源(课件讲稿,打印版)实验五 统计表与统计图.pdf
- 新乡医学院:《卫生统计学》课程教学资源(教案讲义,打印版)实验五 统计表与统计图.pdf
- 新乡医学院:《卫生统计学》课程教学资源(课件讲稿,打印版)实验四 卡方检验.pdf
- 新乡医学院:《卫生统计学》课程教学资源(教案讲义,打印版)实验四 卡方检验(教师:晁灵).pdf
- 新乡医学院:《卫生统计学》课程教学资源(课件讲稿,打印版)实验三 方差分析实验.pdf
- 新乡医学院:《卫生统计学》课程教学资源(教案讲义,打印版)实验三 方差分析.pdf
- 新乡医学院:《卫生统计学》课程教学资源(课件讲稿,打印版)实验二 总体均数的区间估计假设检验(t检验).pdf
- 新乡医学院:《卫生统计学》课程教学资源(教案讲义,打印版)实验二 总体均数的区间估计假设检验(t检验).pdf
- 新乡医学院:《卫生统计学》课程教学资源(课件讲稿,打印版)实验一 计算器使用和计量资料描述(定量资料的统计描述).pdf
- 新乡医学院:《卫生统计学》课程教学资源(教案讲义,打印版)实验一 计量资料描述和计算器使用.pdf
- 南京农业大学:《生物统计与试验设计实验》课程教学大纲.pdf
- 同济大学:《应用统计学》课程电子教案(课件讲稿)Chapter 10 Analysis of Variance(ANOVA).pdf
- 同济大学:《应用统计学》课程电子教案(课件讲稿)Chapter 11 Simple Linear Regression.pdf
- 同济大学:《应用统计学》课程电子教案(课件讲稿)Chapter 12 Time series based Demand Management.pdf
- 同济大学:《应用统计学》课程电子教案(课件讲稿)Chapter 13 Statistical Applications in Quality Management.pdf
- 同济大学:《应用统计学》课程电子教案(课件讲稿)Chapter 5 The Normal Distribution and Sampling Distributions.ppt
- 《概率论与数理统计》课程教学资源(整理资料)Matlab在统计方面的应用.pdf
- 《概率论与数理统计》课程教学资源(整理资料)正态分布的前世今生.pdf
- 《概率论与数理统计》课程教学资源(PPT讲稿)概率论与数理统计知识点总结.pptx
- 西安电子科技大学:《随机过程概论》课程教学资源(课件讲稿)Chapter 4 随机过程通过线性系统.pdf
- 西安电子科技大学:《随机过程概论》课程教学资源(课件讲稿)Chapter 9 检测理论.pdf
- 沈阳航空航天大学:自动化学院《误差理论及数据处理》课程教学大纲.pdf
- 吉林大学:《医学统计学》课程电子教案(PPT课件)第一章 医学统计中的基本概念、第二章 平均水平(集中趋势)的统计描述(主讲:田迎春).ppt
- 吉林大学:《医学统计学》课程电子教案(PPT课件)第三章 离散趋势的统计描述、第四章 抽样误差与假设检验.ppt
- 吉林大学:《医学统计学》课程电子教案(PPT课件)第五章 t检验、第六章 方差分析、第七章 相对数及其应用.ppt
- 吉林大学:《医学统计学》课程电子教案(PPT课件)第六章 方差分析、第七章 相对数及其应用.ppt
- 吉林大学:《医学统计学》课程电子教案(PPT课件)第八章 卡方检验、第九章 非参数检验方法.ppt
- 吉林大学:《医学统计学》课程电子教案(PPT课件)第十章 线性相关与回归.ppt
- 农业院校《试验设计与分析》课程参考资料(多变量分析方法)DUDE - A User-Friendly Crop Information System.pdf
- 农业院校《试验设计与分析》课程参考资料(多变量分析方法)GGE Biplot vs. AMMI Analysis of Genotype-by-Environment Data.pdf
- 农业院校《试验设计与分析》课程参考资料(多变量分析方法)Logistic模型的参数估计.pdf
