山东第一医科大学(泰山医学院):《生物化学》课程实验指导 Biochemistry Experiment Direction(英文,打印版)
Biochemistry Experiment Direction TaiShan Medical College
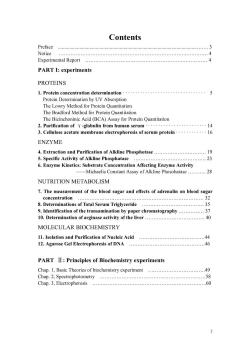
Contents N0ti沁.4 Experimental Report 4,4 PART I:experiments PROTEINS 1.Protein concentration determination.5 Protein Determination by UV Absorption The Lowry Method for Protein Quantitation The Bicinchoninic Acid(BCA)Assay for Protein Quantitation 2.Purification of Y-globulin from human serum.14 3.Cellulose acetate membrane electrophoresis of serum protein.16 ENZYME 4.Extraction and Purification of Alkline 5.Specific Activity of Alkline Phosphatase. .23 6.Enzyme Kinetics:Substrate Concentration Affecting Enzyme Activity -Michaelis Constant Assay of Alkline Phosohatase. .28 NUTRITION METABOLISM 7.The measurement of the blood sugar and effects of adrenalin on blood sugar concentration.32 8.Determinations of Total Serum Triglyceride 35 9.Identification of the transamination by paper chromatography.37 10.Determination of arginase activity of the liver .40 MOLECULAR BIOCHEMISTRY 11.Isolation and Purification of Nucleic Acid44 12.Agarose Gel Electrophoresis of DNA 46 PART II:Principles of Biochemistry experiments Chap.1,Basic Theories of biochemistry experiment.49 Chap.2.Spectrophotometry .58 Chap.3.Electrophoresis .60
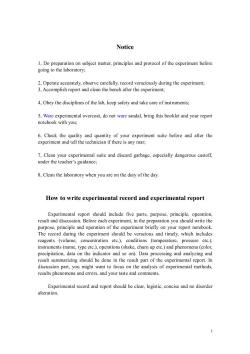
Notice 1.Do preparation on subject matter,principles and protocol of the experiment before going to the laboratory: 2.Operate accurately,observe carefully,record veraciously during the experiment; 3,Accomplish report and clean the bench after the experiment: 4.Obey the disciplines of the lab,keep safety and take care of instruments; 5.Ware experimental overcoat,do not ware sandal,bring this booklet and your repor notebook with you; 6.Check the quality and quantity of your experiment suite before and after the experiment and tell the technician if there is any mar; 7.Clean your xperimental suite and discard garbage,especially dangerous castoff. under the teacher's guidance; 8.Clean the laboratory when you are on the duty of the day. How to write experimental record and experimental report Experimental report should include five parts,purpose,principle,operation. esu and disc sion Before ach purpose,principle and operation of the experiment briefly on your report notebook The record during the experiment should be veracious and timely,which includes reagents (volume,concentration etc.),conditions (temperature,pressure etc.). instruments(name,type etc.),operations(shake,churn up etc.)and phenomena(color precipitation, lata on the indic r and so on).Data processing ar nd analyzing and result summarizing should be done in the result part of the experimenta report. discussion part,you might want to focus on the analysis of experimental methods, results phenomena and errors,and your taste and comments. Experimental record and report should be clear,logistic,concise and no disorder alteration. 3

PART I:EXPERIMENTS Experiment 1 Protein concentration determination According to the proteins'physical,chemical or biological properties,we have developed lots of methods to determining protein concentration.In this article we will study the principle of several protein determination methods to understand their protocols and application. The Lowry method for protein quantitation 1.Principle td is based on both the Biuret reaction.n which the peptide bonds of to prod which 11B0010-u10.J111p with coppe reacts but in essence phosphomolybdotungstate is reduced to heteropolymolybdenum blue by the copper-catalyzed oxidation of aromatic amino acids.The reactions result in a strong blue color,which depends partly on the tyrosine and tryptophan content. Sensitivity of the procedure of Lowry et al.is moderately constant from protein to protein,and it has been so widely used that Lowry protein estimations are a completely acceptable alternative to a rigorous absolute determination in almost all circumstances in which protein mixtures or crude extracts are involved.The method is sensitive down to about 0.01 mg of protein/mL,and is best used on solutions with concentrations in the range 0.01-1.0 mg/mL of protein 2.Materials 1.Standards:Use a stock solution of standard protein (e.g.bovine serum albumin fraction V)containing 250 ug/mL protein in distilled water,stored frozen at _20℃ 2.Complex-forming reagent:Prepare immediately before use by mixing the following stock solutions in the proportion 50:50:1:1 (by vol).(first mix A and B.C and D,respectively,and then mix the two solutions): Solution A:4%(w/v)NazCO;in distilled water Solution B:0.2 mol/L NaOH in distilled water olutio C. 1%(w/v)CuSO5H2O in distilled water Solution D:2%(w/v)sodium potassium tartrate in distilled water. 3.Folin reagent(commercially available):Use at 1 M concentration. 4.Sample:human serum diluted 100 folds with distilled water,store frozen at -20℃. 4
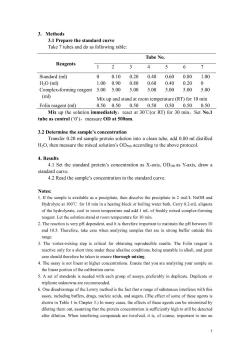
3.Methods 3.1 Prepare the standard curve Take 7 tubes and do as following table: Tube No. Reagents 1 2 3 4 5 6 7 Standard(ml) 010 020 040060 0.801.00 H2O(ml) 1.000.90 0.80 0.60 0.40 0.20 Complex-forming reagent 5.00 5.00 5.00 5.00 5.00 5.00 5.00 (ml) Mix up and stand at room temperature(RT)for 10 min Folin reagent(ml) 0.500.500.500.500.500.500.50 Mix up the solution immediately,react at 30'C(or RT)for 30 min,Set No.1 tube as control(0) measure OD at 500nm 3.2 Determine the sample's concentration Transfer 0.20 ml sample protein solution into a clean tube,add 0.80 ml distilled H2O,then measure the mixed solution's ODsoo according to the above protocol. 4.Results 4.1 Set the standard protein's concentration as X-axis.OD500 as Y-axis.draw a standard curve. 4.2 Read the sample's concentration in the standard curve savailable as a precipitate,then dissolve the precipitate in 2 Hydrolyze at 100'C for 10 min in a heating block or boiling water bath.Carry 0.2-mL aliquots of the hydrolyzate.cool to room temperature and add I mL of freshly mixed complex-forming reagent.Let the solution stand at room tem perature for 10min. 2.The reaction is v pH dependent,and it therefor mportant to maintain the pH between10 and 10.5.Therefore.take are when analyzing sa that are in stronbuffer outside this range 3.The vortex-mixing step is critical for obtaining reproducible results.The Folin reagent is reactive only for a short time under these alkaline conditions,being unstable in alkali,and great care should therefore be taken thoroug mixing. 4.The assay is not line at higher ion.Ensure that you are your sampon the linear portion of the calibration curve. 5.A set of standards is needed with each group of assays,preferably in duplicate.Duplicate or triplicate unknowns are recommended. 6.One disadvantage of the Lowry method is the fact that a range of substanees interferes with this includin s.drugs, ucleic acids.d sugars.(Th effect of some of these agents is shown in Table I in Chapter 3.)In many cases.the effects of these agents can be minimized by diluting them out,assuming that the protein concentration is sufficiently high to still be detected after dilution.When interfering compounds are involved,it is,of course.important to run an

appropriate blank.Interference caused by detergents,sucrose.and EDTA can be eliminated by of precipitation step(sNote 1). 7.The amount of coo produced in this assay by any given protein (or mixture of proteins)is dependent on the amino acid composition of the protein(s)(see Introduction).Therefore,two different proteins.each for example at concentrations of I mg/mL can give different color yields in this assay.It must be appreciated.therefore.that using bovine serum albumin(BSA)(or any eony time when this method gives an absolutealue for protein is when the protein being analyzed is also used to construct the standard curve.The most accurate way to determine the concentration of any protein solution is amino acid analysis. Protein Determination by UV Absorption 1.Principle Protein solutions have a great ultraviolet (UV)absorption at the wavelength of 280nm.Absorption of radiation in the near UV (A28o,or OD2so)by proteins depends on the Tyr and Trp content(and to a very small extent on the amount of Phe and disulfide bonds).So quantitation of the amount of protein in a solution n is possible a simple spectrometer The advantages of this method are that it is simple,and the sample is recoverable. The method has some disadvantages,including interference from other chromophores. and the specific absorption value for a gi ven protein must be determined.The extinctio in the 2-mregio may be as much s 10 times that protein at their same wavelength,and hence,a few percent of nucleic acid can greatly influence the absorption. 2.Materials 2.1.standard protein solution:bovine serum albumin(BSA)solution at 1 mg/ml 2.2 sample (unknown concentration,here we use I mg/ml casein). 2.3 UV-visible spectrometer:The hydrogen lamp should be selected for maximum intensity at the particular wavelength. 3.Methods 3.1 Prepare the standard curve Take 8 tubes and work as the following table: Tube No. Reagents 1 2 3 4 5 6 7 8 Standard(ml) 0 0.50 1.00 1.50 2.002.503.00 4.00 H2O (ml) .003.503.002.502.001.501.00 Concentration(mg/ml)0 0.1250.2500.3750.5000.6250.7501.000 Mix up the reaction system,and measure the A2so with 752-type spectrometer. 6
3.2 Determine the sample's concentration Transfer 1.00 ml sample protein solution into a clean tube,add 3.00 ml distilled HO,then measure the mixed solution's As according to the above protoco 4.Results 4.1 Set the standard protein's concentration as X-axis,Azso as Y-axis,draw a standard curve. 4.2 Read the sample's concentration in the standard curve Notes: 1d280 varies greatly between different proteins (for a I mg/mL solution.from 0 up to 4 [for some tyrosine-rich wool proteins].although most values are in the range 0.5-1.5).It is best to measure absorb ces in th ge 0.05-1.0(between 10 and%of the incident radiation).At aroud 0.3 absorbanc (50%absorption).the accuracy is greatest 2.Bovine serum albumin is frequently used as a protein standard:I mg/mL has an A-8o of 0.66 3.If the solution is turbid.the apparent so will be increased by light scattering.Filtration (through a 0.2-um Millipore filter)or clarification of the solution by centrifugation can be oximate orretion can be applied by at this wave they contain particular chromophores)from the A280 4.At low concentrations,protein can be lost from solution by adsorption on the curve:the high ionic strength helps to prevent this.Inclusion of a nonionic detergent (0.01%Brij35)in the buffer may also help to prevent these losses. 卡i市t2而e il7 hromoph res (e.g.hen se If nucleic gives an accurate estimate of the protein content by removing the contribution to absorbance by nucleotides at 280 nm.by measuring the which is largely owing to the latter Protein (mg/mL)=1.554280-0.76 1260 protein in the posible prese of u ids the followi Protein(mg/mL)=(4235 42802.51 Protein(mg/mL)=0.183A230-0.075.8A260 6.Protein solutions obey Beer-Lambert's Law at 215 nm provided the absorbance is<2.0. 7.Strictly speaking.this value applies to the protein in6M guanidinium-HCl.but the value in buffer is generally within this value. nces in guanidinium-HCl 8.Sodium chloride,ammonium sulfate,borate,phosphate,and Tris do not interfere.whereas 0.1M acetate.succinate.citrate.phthalate.and barbiturate show high absorption at 215 nm. 9.The absorption of proteins in the range 215-225 nm is practically independent of pH between pH values4-8. has been determined.The average extinction coefficient for a I mg/mL solution of 40 serum proteins at 210 nm is 20.5 0.14.At this wavelength.a protein concentration of 2 ug/mL gives A=0.04
.The Bradford Method for Protein Quantitation 1.Principle The Bradford assay relies on the binding of the dye Coomassie Blue G250 to protein.Detailed studies indicate that the free dye can exist in four different ionic forms for which the pKa values are 1.15,1.82,and 12.4.Of the three charged forms of the dye that predominate in the acidic assay reagent solution,the more and green forms have absorbance maxima at 470nm and 650nm respectively.I contrast,the more anionic blue form of the dye,which binds to protein.has an absorbance maximum at 590 nm.Thus,the quantity of protein can be estimated by determining the amount of dye in the blue ionic form.This is usually achieved by measuring the absorbance of the solution at 595 nm. 2.Materials 2.1 Standards:0.I mg/mL casein. 2.2 Sample 2.3 Bradford reagent:The assay reagent is made by dissolving 100 mg of anol The solution is then mixed with 100 mLof85%phosphorieacidandmadeupto1Lwithdistilcdwalcr The reagent should be filtered through Whatman no.1 filter paper and then stored in an amber bottle at room temperature.It is stable for several weeks.However, during this time dye may precipitate from solution and so the stored reagent should be filtered before use 3.Methods 3.1 Prepare the standard curve Take 7 tubes and do as following table: Tube No. Reagents 1 2 3 5 6 7 Standard(ml) 0 0.100.200.300.400.500.60 H-O (ml) 060050 040 030020 0.100 Bradford reagent (ml) 3.003.00 3.00 3.00300 3.00300 Mix up the solution,react at RT for 15 min,Set No.1 tube as control () measure ODat 595nm 3.2 Determine the sample's concentration Transfer 0.50 ml sample protein solution into a clean tube,add 0.10 ml distilled H2O,then measure the mixed solution's ODs9s according to the above protocol. 4.Results 4.1 Set the standard protein's concentration as X-axis,ODsoo as Y-axis,draw a standard curve. 4.2 Read the sample's concentration in the standard curve

Notes: 1.A rapid and accurate method for the stimation of protein is essential in many fields of protein study.n assay originally deseribed by Bradford has become the preferre method for quantifying protein in many laboratories.This technique is simpler.faster.and more sensitive than the Lowry method.Moreover,when compared with the Lowry method,it is subject to less interference by common reagents and nonprotein components of biological samples. on the Bradford Assa Absorbance at 600 nm Compound Blank Control 0.00 0.26 0.029%sD5 0.003 0.250 0 1%6SDS 0042 0059: 0.1%Triton 0.000 0278 0.051 031E I M 2-Mercaptoethanol 0.00 0.27 1 M Sucrose 0.008 0.261 4 M Urea 0.008 0261 4MNaCl 0.015 0.207: 0014 023% 0.1 M HEPES.PH7.0 0.00 0 0.I M Tris.pH 7.5 0.00 0.261 0.1 M Citrate,pH 5.0 0.015 0.249 10 mM EDTA 0007 0215 1 M (NH4)2504 0.002 026 Data were obtained by mixingofsampewith5ofthe speeified compound efre adding00ofdye "Measurements that differ from the control by more than 0.02 absorbance unit for blank values or more than 10% 2.Binding of protein to Coomassie Blue G250 may shift the absorbance maximum of the blue ionic form of the dye from 590 nm to 620 nm.It might,therefore,appear more sensible to measure the absorbance at the higher wavelength.However.at the usual pH of the assay.an appreciable proportion of the dye is in the green form()which interferes with dye-protein compl 620 nm.Mea 505 represents the best compromise between maximizing the absorbence due to the dye-protein complex while minimizing that due to the green form of the free dye 3.The dye does not bind to free arginine or lysine.or to peptides smaller than about 3000 Da Many peptide hormones and other import bioctive peptides fall into the atter category,and the Bradford assay is not suitable for quantifying the amounts of such compounds
The Bicinchoninic Acid(BCA)Assay for Protein Quantitation 1.Principle The bicinchoninic acid (BCA)assay,first described by Smith et al is similar to the Lowry assay,since it also depends on the conversion of Cu to Cu"under alkaline conditions.The Cu'is then detected by reaction with BCA.The two assays are of similar sensitivity,but since BCA is stable under alkali conditions.this assay steps needed in the Lowry assay.The reaction results in the development of an intense purple color with an absorbance maximum at 562 nm.Since the production of Cu"in this assay is a function of protein concentration and incubation time,the protein content of unknown samples may be determined spectrophotometrically by c rison with known protein standards.A further of the BCA a that it is generally more tolerant to the presence of compounds that interfere with the Lowry assay.In particular it is not affected by a range of detergents and denaturing agents such as urea and guanidinium chloride,although it is more sensitive to the of reducing sugars.Both a standard assay (0.1-1.0 mg protein/mL) ssay(0.5-10 ug protein/mL)are descr ribed 2.Materials 2.1.Standard Assay 1.Reagent A:sodium bicinchoninate (0.1 g).NazCOH2O(2.0 g).sodium tartrate (dihydrate)(0.16 g).NaOH (0.4 g).NaHCO3(0.95 g).made up to 100 mL. If necessary,adjust the pH 11.25 with NaHCO,or NaOH. 2.Reagent B:CuSO5H2O(0.4 g)in 10 mL of water (see Note 1). 3.Standard working reagent(SWR):Mix 100 vol of regent A with 2 vol of reagent B.The solution is apple green in color and is stable at room temperature for I wk. 2.2.Microassay 1.Reagent A:(0.8 g).NaOH(1.6 g),sodium tartrate (dihydrate) (1.6 g),made up to 100 mL with water,and adjusted to pH 11.25 with 10 M NaOH 2.Reagent B:BCA(4.0 g)in 100 mL of water 4.Standard w B.then add 26 vol of reagent A. 3.Methods 3.1 Standard Assav 1.To a 100-uL aqueous sample econtaining 10-100 ug protein,add 2 mL of SWR Incubate at 60 C for 30 min (see Note 2). 2.Cool the sample to room temperature,then measure the absorbance at 562 nm (see Note 3). 3.A calibration curve can be constructed using dilutions ofa stock 1 mg/mL
按次数下载不扣除下载券;
注册用户24小时内重复下载只扣除一次;
顺序:VIP每日次数-->可用次数-->下载券;
- 山东第一医科大学(泰山医学院):《医学影像检查技术学》课程实验指导(打印版,共七章).pdf
- 山东第一医科大学(泰山医学院):《医学影像检查技术学》课程教学大纲(打印版,负责人:于兹喜).pdf
- 《医用化学》课程电子教案(PPT教学课件)第十八章 有机含氮化合物.ppt
- 《医用化学》课程电子教案(PPT教学课件)第十九章 杂环化合物(aromatic heterocycles).ppt
- 《医用化学》课程电子教案(PPT教学课件)第二十章 糖类.ppt
- 《医用化学》课程电子教案(PPT教学课件)第二十二章 氨基酸.ppt
- 《医用化学》课程电子教案(PPT教学课件)第二十一章 脂类.ppt
- 《医用化学》课程电子教案(PPT教学课件)第十四章 卤代烃.ppt
- 《医用化学》课程电子教案(PPT教学课件)第十六章 醛酮.ppt
- 《医用化学》课程电子教案(PPT教学课件)第十五章 醇酚醚.ppt
- 《医用化学》课程电子教案(PPT教学课件)第十三章 对映异构.ppt
- 《医用化学》课程电子教案(PPT教学课件)第十七章 羧酸及羧酸衍生物.ppt
- 《医用化学》课程电子教案(PPT教学课件)第六章 化学键和分子结构.ppt
- 《医用化学》课程电子教案(PPT教学课件)第五章 原子结构.ppt
- 《医用化学》课程电子教案(PPT教学课件)第十一章 烯烃和炔烃.ppt
- 《医用化学》课程电子教案(PPT教学课件)第十二章 环烃.ppt
- 《医用化学》课程电子教案(PPT教学课件)第十章 烷烃.ppt
- 《医用化学》课程电子教案(PPT教学课件)第八章 滴定分析法.ppt
- 《医用化学》课程电子教案(PPT教学课件)第七章 配位化合物.ppt
- 《医用化学》课程电子教案(PPT教学课件)第四章 氧化还原反应与电极电势.ppt
- 山东第一医科大学(泰山医学院):《生物化学》课程各章习题集(打印版,含参考答案).pdf
- 南方医科大学:《分析化学》课程教学大纲 Analytical Chemistry.docx
- 南方医科大学:《分析化学》课程教学资源(作业习题)分析化学(第8版)课后习题参考解答.pdf
- 南方医科大学:《分析化学》课程教学资源(PPT课件)第一章 绪论 Analytical chemistry(主讲:刘利红).ppt
- 南方医科大学:《分析化学》课程教学资源(PPT课件)第二章 误差和分析数据处理 2.1 测量值的准确度和精密度.ppt
- 南方医科大学:《分析化学》课程教学资源(PPT课件)第二章 误差和分析数据处理 2.2 有效数字及其运算规则、2.3 有限量测量数据的统计处理(1/2).ppt
- 南方医科大学:《分析化学》课程教学资源(PPT课件)第二章 误差和分析数据处理 2.3 有限量测量数据的统计处理(2/2).ppt
- 南方医科大学:《分析化学》课程教学资源(PPT课件)第三章 滴定分析法概论(1/2).ppt
- 南方医科大学:《分析化学》课程教学资源(PPT课件)第三章 滴定分析法概论(2/2).ppt
- 南方医科大学:《分析化学》课程教学资源(PPT课件)第五章 配位滴定法 Complex formation Titration.pptx
- 南方医科大学:《分析化学》课程教学资源(PPT课件)第四章 酸碱滴定法 Acid-base titration.pptx
- 南方医科大学:《分析化学》课程教学资源(PPT课件)第六章 氧化还原滴定法(1/3).ppt
- 南方医科大学:《分析化学》课程教学资源(PPT课件)第六章 氧化还原滴定法(2/3).ppt
- 南方医科大学:《分析化学》课程教学资源(PPT课件)第六章 氧化还原滴定法(3/3).pptx
- 南方医科大学:《分析化学》课程教学资源(PPT课件)第八章 重量分析法(主讲:田元新).ppt
- 南方医科大学:《分析化学》课程教学资源(PPT课件)复习串讲课件.pptx
- 海南大学:《无机化学》课程教学大纲 Inorganic Chemistry.pdf
- 海南大学:《无机化学》课程教学资源(作业习题)第一章 气体(含解答).doc
- 海南大学:《无机化学》课程教学资源(作业习题)第二章 热化学(含解答).doc
- 海南大学:《无机化学》课程教学资源(作业习题)第三章 化学动力学基础(含解答).doc
