《国际期货市场运作》课程教学课件(PPT讲稿)Chapter 10 Technical Analysis Chart Patterns
Chapter 10 Technical Analysis:Chart Patterns 08/082003C=918242 160 H=9190 L=8965 Mov Avg-Exponential 10500 10000 9500 9000 8500 8000 7500 2002 2003 Created with SuperCharts by Omega Research 1997
Technical Analysis: Chart Patterns Chapter 10
The Wave Theories R.N.Elliott pointed out that the stock market unfolds(展开)according to a basic rhythm or pattern of five waves up and three waves down to form a complete cycle of eight waves
The Wave Theories R.N. Elliott pointed out that the stock market unfolds(展开) according to a basic rhythm or pattern of five waves up and three waves down to form a complete cycle of eight waves
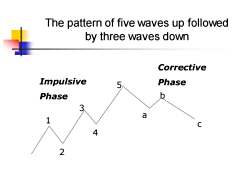
The pattern of five waves up followed by three waves down Corrective Impulsive 5 Phase Phase b a C 4
The pattern of five waves up followed by three waves down 1 2 3 4 5 b a c Impulsive Phase Corrective Phase
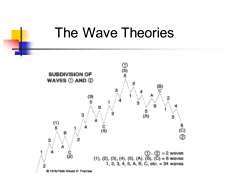
The Wave Theories SUBDIVISION OF 5 WAVES①AND② 2 3 恩 1 2 5 1 4 3 3 点 3 5 品 5 ② 3 2 ①.②=2wav8s (1).2.(3).(4).(5).(A).B).C)=8 waves 2 1,2,3,4,5,A,B.C,etc.=34 waves
The Wave Theories
The Bar Chart A price bar might represent a period as short as five minutes or as long as a month. The most common is the daily bar chart
The Bar Chart ◼ A price bar might represent a period as short as five minutes or as long as a month. ◼ The most common is the daily bar chart
Bar Chart HIGH CLOSE OPEN LOW
Bar Chart
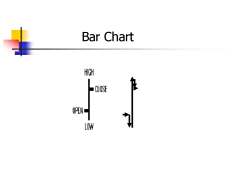
Bar Chart Open.The first price traded that day. High.The highest price traded that day. Low.The lowest price traded that day. Close.The last,or closing price,traded that day.Also called the settle
◼ Open. The first price traded that day. ◼ High. The highest price traded that day. ◼ Low. The lowest price traded that day. ◼ Close. The last, or closing price, traded that day. Also called the settle. Bar Chart
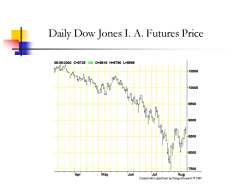
Daily Dow Jones I.A.Futures Price 08/092002C=87254300=8616H=8790L=8565 10500 10000 9500 9000 -8500 8000 7500 Apr May Jun Jul Aug Created with SuperCharts by Omega Research1997
Daily Dow Jones I. A. Futures Price
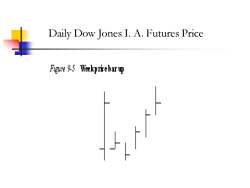
Daily Dow Jones I.A.Futures Price Figure95Wekp立eharφ
Daily Dow Jones I. A. Futures Price
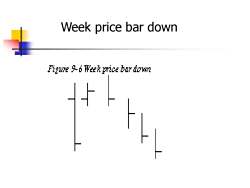
Week price bar down igwe只6eR切ice bar dow
Week price bar down
按次数下载不扣除下载券;
注册用户24小时内重复下载只扣除一次;
顺序:VIP每日次数-->可用次数-->下载券;
- 《国际期货市场运作》课程教学课件(PPT讲稿)Chapter 4 Life on the Trading Floor.ppt
- 《国际期货市场运作》课程教学课件(PPT讲稿)Chapter 5 The Variety of Futures Markets.ppt
- 《国际期货市场运作》课程教学课件(PPT讲稿)Chapter 6 Getting Started in Trading Futures.ppt
- 《国际期货市场运作》课程教学课件(PPT讲稿)Chapter 7 Hedging with Spreads.ppt
- 《国际期货市场运作》课程教学课件(PPT讲稿)Chapter 3 The Modern Futures Exchange.ppt
- 《国际期货市场运作》课程教学课件(PPT讲稿)Chapter 2 Beginning with the Basics.ppt
- 《国际期货市场运作》课程教学课件(PPT讲稿)Chapter 0 International Futures Markets Operation.ppt
- 《国际期货市场运作》课程教学课件(PPT讲稿)Chapter 1 The Journey Ahead.ppt
- 《国际期货市场运作》课程授课教案(讲义,英文版).doc
- 《国际期货市场运作》课程教学大纲 International Futures Market Operation.doc
- 《计量经济学》课程教学课件(PPT讲稿)12 时间序列计量经济模型.ppt
- 《计量经济学》课程教学课件(PPT讲稿)07 自相关(Autocorrelation).ppt
- 《计量经济学》课程教学课件(PPT讲稿)10 滞后变量模型.ppt
- 《计量经济学》课程教学课件(PPT讲稿)11 联立方程模型的识别和估计.ppt
- 《计量经济学》课程教学课件(PPT讲稿)09 K元线性回归模型的扩展.ppt
- 《计量经济学》课程教学课件(PPT讲稿)08 随机解释变量.ppt
- 《计量经济学》课程教学课件(PPT讲稿)06 广义最小二乘法(GLS)与异方差(Heteroskedasticity).ppt
- 《计量经济学》课程教学课件(PPT讲稿)02 简单线性回归模型.ppt
- 《计量经济学》课程教学课件(PPT讲稿)05 多重共线性(Multicollinearity).ppt
- 《计量经济学》课程教学课件(PPT讲稿)01 计量经济学基本问题.ppt
- 《国际期货市场运作》课程教学课件(PPT讲稿)Chapter 11 Timing Indicators.ppt
- 《国际期货市场运作》课程教学课件(PPT讲稿)Chapter 8 How to Trade the Futures Options.ppt
- 《国际期货市场运作》课程教学课件(PPT讲稿)Chapter 9 Fundamental Analysis.ppt
- 《审计学》课程教学大纲 Auditing(64学时).doc
- 《审计学》课程教学大纲 Audit of financial(财务审计,64学时).doc
- 《审计学》课程授课教案(64学时,石河子大学:池玉莲).doc
- 《审计学》课程授课教案(2011-2012,上,石河子大学:池玉莲).doc
- 《审计学》课程授课教案(2015-2016,下,48学时,石河子大学:池玉莲).doc
- 《审计学》课程教学资源(试卷习题)审计习题集(答案,非注册班).doc
- 《审计学》课程教学资源(试卷习题)审计习题集(题目,非注册班).doc
- 《审计学》课程教学资源(试卷习题)审计学习题集(答案108).doc
- 《审计学》课程教学资源(试卷习题)审计学习题集(题目108).doc
- 《审计学》课程教学资源(试卷习题)审计学各章习题集(答案2103).doc
- 《审计学》课程教学资源(试卷习题)第八章 审计报告和管理建议书(题目2103).doc
- 《审计学》课程教学资源(试卷习题)第六章 内部控制及其评价(题目2103).doc
- 《审计学》课程教学资源(试卷习题)第五章 审计程序(题目2103).doc
- 《审计学》课程教学资源(试卷习题)第七章 审计抽样(题目2103).doc
- 《审计学》课程教学资源(试卷习题)第三章 审计的分类和方法(题目2103).doc
- 《审计学》课程教学资源(试卷习题)第二章 审计组织与审计规范(题目2103).doc
- 《审计学》课程教学资源(试卷习题)第四章 审计证据与审计工作底稿(题目2103).doc
