电子科技大学:《数据分析与数据挖掘 Data Analysis and Data Mining》课程教学资源(课件讲稿)Lecture 03 Regression Analysis(Logistic Regression)
Lecture 3 Regression Analysis Dr.李晓瑜Xiaoyu Li Email:xiaoyuuestc@uestc.edu.cn http://blog.sciencenet.cn/u/uestc2014xiaoyu 2019-Spring SunData Group http://www.sundatagroup.org School of Information and Software Engineering,UESTC 1966 Copyright2019 by Xiaoyu Li
Dr.李晓瑜 Xiaoyu Li Email:xiaoyuuestc@uestc.edu.cn http://blog.sciencenet.cn/u/uestc2014xiaoyu 2019-Spring Lecture 3 Regression Analysis SunData Group http://www.sundatagroup.org/ School of Information and Software Engineering, UESTC Copyright © 2019 by Xiaoyu Li. 1
sunData Groun Review 1 Simple Linear Regression .2 Multiple Regression 3 Understanding the Regression Output .4 Coefficient of Determination R2 .5 Validating the Regression Model 3 Copyright 2019 by Xiaoyu Li
Review 1 Simple Linear Regression 2 Multiple Regression 3 Understanding the Regression Output 4 Coefficient of Determination R2 5 Validating the Regression Model Copyright © 2019 by Xiaoyu Li. 3

Practice of Regression Choose which independent variables to include in the model, based on common sense and context specific knowledge. Collect data(create dummy variables in necessary). Run regression-the easy part. Analyze the output and make changes in the model-this is where the action is. ·Test the regression result on“out-of-sample”data DATA 4 Copyright 2019 by Xiaoyu Li
Copyright © 2019 by Xiaoyu Li. 4 Practice of Regression
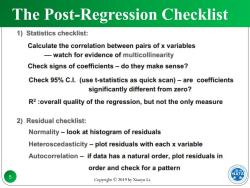
The Post-Regression Checklist 1)Statistics checklist: Calculate the correlation between pairs of x variables -watch for evidence of multicollinearity Check signs of coefficients-do they make sense? Check 95%C.I.(use t-statistics as quick scan)-are coefficients significantly different from zero? R2:overall quality of the regression,but not the only measure 2)Residual checklist: Normality-look at histogram of residuals Heteroscedasticity-plot residuals with each x variable Autocorrelation-if data has a natural order,plot residuals in order and check for a pattern ATA 5 Copyright 2019 by Xiaoyu Li
Copyright © 2019 by Xiaoyu Li. 5 The Post-Regression Checklist
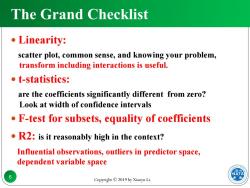
The Grand Checklist Linearity: scatter plot,common sense,and knowing your problem, transform including interactions is useful. t-statistics: are the coefficients significantly different from zero? Look at width of confidence intervals .F-test for subsets,equality of coefficients .R2:is it reasonably high in the context? Influential observations,outliers in predictor space, dependent variable space DATA 6 Copyright 2019 by Xiaoyu Li
Copyright © 2019 by Xiaoyu Li. 6 The Grand Checklist Linearity: scatter plot, common sense, and knowing your problem, transform including interactions is useful. t-statistics: are the coefficients significantly different from zero? Look at width of confidence intervals F-test for subsets, equality of coefficients R2: is it reasonably high in the context? Influential observations, outliers in predictor space, dependent variable space
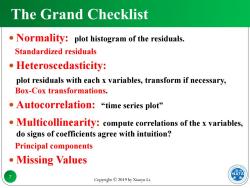
The Grand Checklist Normality:plot histogram of the residuals. Standardized residuals Heteroscedasticity: plot residuals with each x variables,transform if necessary, Box-Cox transformations. .Autocorrelation:“time series plot” Multicollinearity:compute correlations of the x variables, do signs of coefficients agree with intuition? Principal components Missing Values DATA Copyright 2019 by Xiaoyu Li
Copyright © 2019 by Xiaoyu Li. 7 The Grand Checklist Normality: plot histogram of the residuals. Standardized residuals Heteroscedasticity: plot residuals with each x variables, transform if necessary, Box-Cox transformations. Autocorrelation: “time series plot” Multicollinearity: compute correlations of the x variables, do signs of coefficients agree with intuition? Principal components Missing Values

Group Today Topic encead Logistic Regression 8 Copyright 2019 by Xiaoyu Li
Today Topic Copyright © 2019 by Xiaoyu Li. 8 Logistic Regression
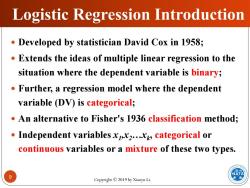
Logistic Regression Introduction Developed by statistician David Cox in 1958; Extends the ideas of multiple linear regression to the situation where the dependent variable is binary; Further,a regression model where the dependent variable (DV)is categorical; An alternative to Fisher's 1936 classification method; .Independent variablesxx2...x categorical or continuous variables or a mixture of these two types. ATA 9 Copyright 2019 by Xiaoyu Li
Copyright © 2019 by Xiaoyu Li. 9 Logistic Regression Introduction Developed by statistician David Cox in 1958; Extends the ideas of multiple linear regression to the situation where the dependent variable is binary; Further, a regression model where the dependent variable (DV) is categorical; An alternative to Fisher's 1936 classification method; Independent variables x1 ,x2…xk , categorical or continuous variables or a mixture of these two types

Example 1:Market Research The data in Table 1 were obtained in a survey conducted by AT T in the US from a national sample of co-operating households. Table 1:Adoption of New Telephone Service High School or below Some College or above No Change in Change in No change in Change in Residence during Residence during Residence during Residence during Last five years Last five years Last five years Last five years Low 153/2160=0.071 226/1137=0.199 61/886=0.069 233/1091=0.214 Income High 147/1363=0.108 139/547=0.254 287/1925=0.149 382/1415=0.270 Income ATA 10 Copyright 2019 by Xiaoyu Li
Copyright © 2019 by Xiaoyu Li. 10 Example 1:Market Research The data in Table 1 were obtained in a survey conducted by AT & T in the US from a national sample of co-operating households
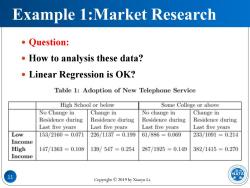
Example 1:Market Research Question: How to analysis these data? Linear Regression is OK? Table 1:Adoption of New Telephone Service High School or below Some College or above No Change in Change in No change in Change in Residence during Residence during Residence during Residence during Last five years Last five years Last five years Last five years Low 153/2160=0.071 226/1137=0.199 61/886=0.069 233/1091=0.214 Income High 147/1363=0.108 139/547=0.254 287/1925=0.149 382/1415=0.270 Income ATA 11 Copyright 2019 by Xiaoyu Li
Copyright © 2019 by Xiaoyu Li. 11 Example 1:Market Research Question: How to analysis these data? Linear Regression is OK?
按次数下载不扣除下载券;
注册用户24小时内重复下载只扣除一次;
顺序:VIP每日次数-->可用次数-->下载券;
- 电子科技大学:《数据分析与数据挖掘 Data Analysis and Data Mining》课程教学资源(课件讲稿)Lecture 02 Raw Data Analysis and Pre-processing(2.1-2.4).pdf
- 电子科技大学:《数据分析与数据挖掘 Data Analysis and Data Mining》课程教学资源(课件讲稿)Lecture 02 Raw Data Analysis and Pre-processing(2.5-2.7).pdf
- 电子科技大学:《数据分析与数据挖掘 Data Analysis and Data Mining》课程教学资源(课件讲稿)Lecture 01 Overview Data Analysis and Data Mining(李晓瑜).pdf
- 电子科技大学:《数据分析与数据挖掘 Data Analysis and Data Mining》课程教学资源(课件讲稿)量子降维算法.pdf
- 电子科技大学:《数据分析与数据挖掘 Data Analysis and Data Mining》课程教学资源(课件讲稿)量子神经网络(Neural Network,NN).pdf
- 电子科技大学:《数据分析与数据挖掘 Data Analysis and Data Mining》课程教学资源(课件讲稿)量子支持向量机(support vector machine, SVM).pdf
- 电子科技大学:《数据分析与数据挖掘 Data Analysis and Data Mining》课程教学资源(课件讲稿)量子机器学习(量子K-means算法).pdf
- 电子科技大学:《数据分析与数据挖掘 Data Analysis and Data Mining》课程教学资源(课件讲稿)隐马尔科夫算法.pdf
- 电子科技大学:《数据分析与数据挖掘 Data Analysis and Data Mining》课程教学资源(课件讲稿)降维算法.pdf
- 电子科技大学:《数据分析与数据挖掘 Data Analysis and Data Mining》课程教学资源(课件讲稿)分类算法(朱钦圣).pdf
- 电子科技大学:《数据分析与数据挖掘 Data Analysis and Data Mining》课程教学资源(课件讲稿)聚类算法.pdf
- 电子科技大学:《数据分析与数据挖掘 Data Analysis and Data Mining》课程教学资源(课件讲稿)量子力学.pdf
- 电子科技大学:《数据分析与数据挖掘 Data Analysis and Data Mining》课程教学资源(课件讲稿)决策树.pdf
- 电子科技大学:《数据分析与数据挖掘 Data Analysis and Data Mining》课程教学资源(课件讲稿)线性模型.pdf
- 电子科技大学:《数据分析与数据挖掘 Data Analysis and Data Mining》课程教学资源(课件讲稿)模型评估与选择.pdf
- 电子科技大学:《数据分析与数据挖掘 Data Analysis and Data Mining》课程教学资源(课件讲稿)绪论.pdf
- 南京大学:《软件工程 Software Engineering》课程教学资源(PPT课件讲稿)Part 25 软件开发的新方法 New Methodology(Agile方法).ppt
- 南京大学:《软件工程 Software Engineering》课程教学资源(PPT课件讲稿)Part 24 软件工程中的高级课题 Advanced Topics in Software Engineering.ppt
- 南京大学:《软件工程 Software Engineering》课程教学资源(PPT课件讲稿)Part 23 软件过程、管理与质量 Software Process, Management, and Quality.ppt
- 南京大学:《软件工程 Software Engineering》课程教学资源(PPT课件讲稿)Part 22 面向对象软件工程 Object-Oriented Software Engineering(Unified Modeling Language, UML).ppt
- 电子科技大学:《数据分析与数据挖掘 Data Analysis and Data Mining》课程教学资源(课件讲稿)Lecture 03 Regression Analysis and Classification.pdf
- 电子科技大学:《数据分析与数据挖掘 Data Analysis and Data Mining》课程教学资源(课件讲稿)Lecture 05 Clustering Analysis.pdf
- 电子科技大学:《数据分析与数据挖掘 Data Analysis and Data Mining》课程教学资源(课件讲稿)Lecture 04 Association Rules of Data Reasoning(Apriori Algorithm、Improve of Apriori Algorithm).pdf
- 电子科技大学:《数据分析与数据挖掘 Data Analysis and Data Mining》课程教学资源(课件讲稿)Lecture 04 Association Rules of Data Reasoning(FP-growth Algorithm).pdf
- 电子科技大学:《数据分析与数据挖掘 Data Analysis and Data Mining》课程教学资源(课件讲稿)Lecture 04 Association Rules of Data Reasoning.pdf
- 电子科技大学:《数据分析与数据挖掘 Data Analysis and Data Mining》课程教学资源(课件讲稿)Lecture 06 Classification.pdf
- 电子科技大学:《算法设计与分析 Algorithms Design and Analysis》课程教学资源(课件讲稿)第一章 算法概述 Algorithm Introduction(刘瑶、陈佳).pdf
- 电子科技大学:《算法设计与分析 Algorithms Design and Analysis》课程教学资源(课件讲稿)第二章 递归与分治策略.pdf
- 电子科技大学:《算法设计与分析 Algorithms Design and Analysis》课程教学资源(课件讲稿)第三章 动态规划 Dynamic Programming.pdf
- 电子科技大学:《算法设计与分析 Algorithms Design and Analysis》课程教学资源(课件讲稿)第四章 贪心算法(Greedy Algorithm).pdf
- 电子科技大学:《算法设计与分析 Algorithms Design and Analysis》课程教学资源(课件讲稿)第五章 回朔法(Backtracking Algorithm).pdf
- 电子科技大学:《算法设计与分析 Algorithms Design and Analysis》课程教学资源(课件讲稿)第六章 分支限界法(Branch and Bound Method).pdf
- 上饶师范学院:《数据库系统原理 An Introduction to Database System》课程教学资源(电子教案,颜清).doc
- 电子科技大学:《算法设计与分析 Design and Analysis of Algorithms》研究生课程教学资源(课件讲稿,英文版)01 Introduction(肖鸣宇).pdf
- 电子科技大学:《算法设计与分析 Design and Analysis of Algorithms》研究生课程教学资源(课件讲稿,英文版)Stable Matching.pdf
- 电子科技大学:《算法设计与分析 Design and Analysis of Algorithms》研究生课程教学资源(课件讲稿,英文版)02 Basics of algorithm design & analysis.pdf
- 电子科技大学:《算法设计与分析 Design and Analysis of Algorithms》研究生课程教学资源(课件讲稿,英文版)03 Maximum Flow.pdf
- 电子科技大学:《算法设计与分析 Design and Analysis of Algorithms》研究生课程教学资源(课件讲稿,英文版)04 NP and Computational Intractability.pdf
- 电子科技大学:《算法设计与分析 Design and Analysis of Algorithms》研究生课程教学资源(课件讲稿,英文版)05 Approximation Algorithms.pdf
- 电子科技大学:《现代密码理论 Modern Cryptographic Theory》课程教学资源(课件讲稿)第1章 概述(李发根).pdf
