《质量管理与认证》课程教学资源(文献资料)JQT 1994-26-2-79-87 integrating statistical process control and engineering process control

Integrating Statistical Process Control and Engineering Process Control DOUGLAS C.MONTGOMERY and J.BERT KEATS Arizona State Universily,Tempe,AZ 85287-5906 GEORGE C.RUNGER Inteructive Qualily,Tuscon,AZ 85715 WILLIAM S.MESSINA Walsh America,Phocniz,AZ85299 Statistical process control(SPC)is traditionally applied to processes that vary about a fixed mean and where successive viewed as statistically independent.Engineering(EPC) are rel time,and where them eliminating assignable causes of variation.This paper shows through simulation that when using EPC it is always better to have an SPC system in place that monitors and acts properly on the root cause of the assignable change Introduction They give several reasons why disparitics between the two industries,and hence means of controlling criti- Smg cal process variables,are becoming smaller. ment that h d inde reductio ohiective although they seek 2)prov an ex mplish these objectives in different ways. statistical ss monitoring)and engineer ing pro SPClooks for signals representing asignable ca cess contro which they refer to as automatic pr contro(APC)).Th n that the origin that the process data can be described in terms whereas APC had its origins in the f statistically independent obser ean adiustments to manipulat Fellow o ble process variables.EPC is usually discussed ir ASQC he fr ework of a process wit a drilt n,an Dr.Keats is au associate Professor in the of e objective Ind rial and m ent Systema Engine ring and Dir in the output variable to an input control variable. gleMeer of There is in the cTece s.SPC is ofter D and Marketing Re n"tool,driven by upper management(or ers)as part of a company-wide quality im- Vol.26,No.2,April 1994 79 Quality Technolog

D.C.MONTGOMERY.J.B.KEATS,G.C.RUNGER.AND W.S.MESSINA provement process,while EPC is often n "bottom 1.Leave the funnel fixed and aimed a the rgel up"procedure,driven by process control or mnn- engineers.In effect,the role of SPC is 2.If the distance from the resting place of the marble to the target isY,then move the funnel n distance rom its current position cess to counteract ongoing forces that 3.The same rule2,but move the funnel adistance process to drift off-target if compensations are no -y from the target e,SPC does not control the process,but olinleOoorioctnhatsgua ova of the root the hand,EPC does not remove the root or assignable these four rules.Rule 1 alw Rule produces a ingooo process var tained with rule 5之 plodes. sin th 8na h integration is useful becnuse im awny from the target,but it m cly result. An and behaves like a random walk. the cffect itor the process for detectio to mon to de happen when one“tampers'”with a stable p sultinadditionalroductionofovcrallvariability.in- this con- ess,and when do and Doganaksoy (1992). and Ia assignable cnuscs (and make adjustmcuts)audwe (1990)have emphasized the importanceof to leave the process alone trated by simulation thnt if the process mean fixed,control ctions will be worse than no coutrol, even rule in a reasonably geuernl situntio showed that the minimum mean square extreme cases,al. utpe situation to th 2hefnamdpositioimned sum of all The Process Model control rule is what is referred to as inte MacGregor(1990)presented an instru of gain of unity.Integral coo aplication ong beer industries.In 1950) In this exp a ring stand is placed over coutrol for of cve"A funel is with a ized by rapid gnin,that is,quick res arcdopolhroughuhcfmnaclAaraClilrori crs ol on th according to one of several rules. e proposed by Deming re the following. chlorine gas flow to pulp mnss in a blench lant.In Joural of Quality Technology Vol.26,No.April 1994

INTEGRATING STATISTICAL PROCESS CONTROL AND ENGINEERING PROCESS CONTROL the discrete parts areas,cutting tool manufacturers ndwhieaoig (y nipulate the t Of co on of The coutrol action of eguation (3)is based on us the MMSE coutroller as dise ssed by Box and lent in the process industries.are now being applied Jenkins (1976).MacGregor(1990)showed that this in the parts industrics as well whe some graph Yi =u+n+et (1) where Y ist i the encouteouorsntrolastistas s riod t These resu 59m that the are no wiegnable tionn.is the ellect of the underly an from equation (2)and the and e is an indepen ent ra random disturbance terme inequation(1).We now el. zero and the that thi of the .is the position of the funnel after the(1 control action,and is the underlying external changes (i.c. drop.The quant assigmable causcs).If however,either the model is one (e()T inappropriate,such as mis-specifie ame the mo m om-1+at (2) where-1<d<1 and the at's are randomn variables n tar with mean zero and variance that are independent to be of one oft d if the gnable causes are eliminated,consider able reduction in output variability can be obtain of which model (2)is an examp The as signable causes take the form r a st M( the pro an or a t thSPC.It should be mentioned that EPC crib such as is s (eg a tren rrelation in the mean gnable causcs are typ an described by equation(1and (2),MacGrego case in the developtnents (1990)suggested the control action 4=4-1-(中-0)Y (3) An ExamDle We first show a simple example and then give the ()) esults of a more comprelensive simulation study Figure 1 shows the output for 500 model in equation (2)is co mbined with the white e pr the by mdredet 197G n n (3) The parameter volues are=0.95 and MacGregor and HIarris (1993,p.110).These 0=0.4,which are the same as those used by Mac authors point out that the sumn of an AR(1)process Gregor (1990).The values of t Vol.26,No.April 1994 Journalof Quality Technology

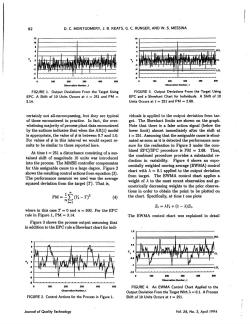
82 D.C.MONTGOMERY,J.B.KEATS,G.C.RUNGER,AND W.S.MESSINA 4出 the FIGURE 3.Outpu Deviations from the Tar 3.14 Units Occurs at t=251 and PM =2.68. certainly not all-encompassing.but they are typical of those encountered in practice.In fact,the over- untered et te2oao的aa viduals is applied to the output deviation from tar d1.0. that the For values of in this interval we would expect re- nated as soon as it is detected the performance men sults to be similar to those reported here. sure for the realization in Figure 3 under the com- bined EPC/SPC procedure is PM=2.6 shift of ne ure prov ntial re The MMSE C ecomb (EWMA) trol chart with A=0.1 ap plied to the output deviation shows the resulting control actions from eauation (3) The performance measure we used was the average from target.The EWMA control chart applies a most recent obe squared deviation from the target (T).That is, weight of A to the rvation and ge metrically decr prior obs ut to plottedon (4) Z4=AY+(1-)Z. The EWMA control chart was explained in detai 4 ta. FIGURE 4.An EWMA Control Chart Applied on N FIGURE 2.Control Actions for the Process in Figure 1 Shift of 10 Units Occurs at t=251 of Qvality Technolog Vol.26,No.April 19

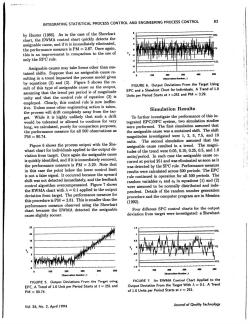
INTEGRATING STATISTICAL PROCESS CONTROL AND ENGINEERING PROCESS CONTROL by Hunte As in the case of the Shewhart rol chart quickly detects the the perforance measure is PM 2.8 able cau ses ma y take form s other than sus that an ignable cause re 1e g in a trend impacted the process model given by equations (2)and (3). Figure 5 shows the FIGURE 6.Outpu ng that the EPC and a y ar of cquation (3)is Units per Period St t=251 and PM=3.29. Clearly,this control rule is now ineffec tive.other engineering ac tion is Simulation Results get be that such a drift to continue for very The first sir fThe shift 1.25,7.5 And 10 The assumed that th Figure6sho with the she put de assignable cause resulted in a trend in the assignable cause tudes of the trend w d vere 0.0: .10 1.0 target.Once is quickly identified,and if it is im units nmediately remo /period. the performance measure is PM curr =3.29 the SPC rule.Performance measure ere periods.The EP signa rule continued in operation for all 500 p (1)ar random variables et and ated.Figure 7 shows d inde the EWMA chart with=0.1 applied to the output the dom number generation e and the computer program are in Messina the Shewhart 1992. Four different SPC control cause slightly sooner. deviation fron target were 4 400 100 on Number, end of 1.0 Unit per Period Starts at t=251 and PM=90.74. Vol.26,No.2,April 1994 Journal of Quality Technolog)

D.C.MONTGOMERY,J.B.KEATS,G.C.RUNGER,AND W.S.MESSINA lation runs. ance 1=04nd3 limits and。c ds 1-250)Each in for p (CUSUM)with =0.5 and h=5.Details concern- formance measure for period 251-500 for either the EPC rule or some combination of EPC and an SPC ght. was 100 t the perlorr nearly identical weigh re prior is t vious obser ationsas do the Westeru coluns imply that the /SPC che This EWMA does not have the same avera has a smalle r performance measure than the EPC hart cha he ule alone. e is some ind ication that the Sh data in nearly the same way. other SPC charts for the la cifically 7.5 Some experimenters compare statistical monitor and 10.0.We conclude that integrating an SPCrule with EPC iatio ing s ing parar of the rom t to select par he a range of shifts such as the CUSUM with =0. to Table 2 pres nts the ARL's observed in the sim uch a the e The smd ts re mos the ARL of va that theR instead to demonstrate that several widely used pr is that with the EPC rule the effect of an assignable cedures operating with nominal design parameters causes is converted from a step change in a correlated O B ter d change in I an nen esults for pensate for t largely con mance measure from equation(O)and the Table 3 esulta analo to standard error (in parentheses)based on 2000 simu- those in Table 1.ssuming that the s TABLE 1.Averages of the Performance Measures for EPC/SPC Rules Based on00Simulations rocess Mean at Observation 251.Standard Deviations Shift EPC EPC and Magnitude to Shift EWMA A=0.1 入=0.4 h=5,k=0.5 1 2.552 2.552 2.552 2.552 (0.0052) (0.0053) (0.0053) (0.0052) 2 2.538 2.679 2.594 2.594 2.594 2.593 (0.0051) (0.0064 (0.0052) (0.0052) (0.0052) (0.0052) 5 2.552 2.929 2.754 2.811 2.793 2.785 (0.0050) (0.0077 (0.0053) (0.0054) (0.0054) (0.0053) 7.5 2.544 3.298 2.062 3.033 2.929 2.943 (0.0045) (0.0098) (0.0056) 0.0059) (0.0058) (0.0057) 10 2.544 3.838 3.094 3.273 3.111 3.311 (0.0051) (0.0123) (0.0061) (0.0066) (0.0066) (0.0061) Joumal o Quality Technology Vol.26,No.2,April 1994

INTEGRATING STATISTICAL PROCESS CONTROL AND ENGINEERING PROCESS CONTROL TABLE 2.Average Run Lengths for the Rules in Table 1.Standard Deviations of the Run Length are Given in Parenthesis EPC and EPC and Shewhar A=0.4 h=5,k=0.5 品 5 7.5 10 (6.) 3 (02) d of 0. 5,010.025050 and period rr rall,the EWMA CUSUM per perc nc :11 an EPO similarly hen 4ned.e,ad iusted)for s indication that the three non-She shift conditions (see Lucas and Saccucci (1990)). provide more reduction in variability than does the ances it may be better to Shewhart chart for individuals.The EWMA with itortheontolariabiethan"heutpatreHae 入=0.1 and the CUSUM are particularly effective investigated the efTect of applying the SPC proce- Tal ate dure to the control actions c var d th the manipulate ave Al mery,and eat s when the of nd is 0.10 un its pe C/SPC tha ith EPC alone. were achieved TABLE: EPC/SPC R of the Performance Measure are Given in Parenthesis Trend EPC 0.1 h=5,k= 05 0.5 7 9778 (0.0050 0.0 71 0. (0.0077 0.0061) 0.10 2534 98 519 593 (0.0051) 0. (0.0072) (0.0144 (0.0068 0.25 2543 963 2g1 467 291 0.0051) t0.0166) (0.0304) (0.0080) (0.0155 (0.0077 0.50 165 2.976 3413 2.910 (0.0051) 1003251 (0.0309) (0.0079) (0.0154 (0.0076) 1.00 170573 3814 2.080 2.885 (0.0051) (0.0620) (0.0261) (0.0076) (0.0113) (0.0071) Vol.26,No.2.April 1994 Journal of Qualily Technology

D.C.MONTGOMERY.J.B.KEATS.G.C.RUNGER,AND W.S.MESSINA TABLE4.Averag Run Lenths for the Rules in Table3.Standard Deviations f the Run th are Given in Parenthesis Mo Trend EPC and EPC and EPC and EWMA EWMA CUSUM 入=0.1 入=0.4 h=5k=0.5 0.05 119.9 119.8 149.2 (1.61) (1.23) (1.47 0.10 109.7 73.5 109.2 1.39 (0.70) (1.06) 0.25 60.8 33.9 (0.68) (0.30) 62品 0.50 32.1 17.4 24.2 (0.36) (0.15) (0.24 1.00 14.3 9.1 10.0 (0.17 (0.07) (0.09) Summary mical and s plants and in computer inte- desirable results.EP an important too to ons fom to that o provement procese of the s itself,and Acknowledgment an be used to identify and subsequently eliminate and su s and the Editor for aps a n References ,O.D.(1976).Time Series and Forecasting.But- We described and illustrated a simple ndo Gregor Box,G.E (1990)model of the erim nt we shov a p cal Pr es certain e ernal assignable causes.Bot h sus tained shifts and nds SPC o: me Theory of Sampling.John Wi- mo ation fro in a system ey &Sons,New York,NY. MIT Center for engin eering)control is a simple but highly effective way to integrate thes Minc,W.E.(13).The We conclude that prope for LTIN,F.W.;HARN,G.J.;and TUCKER,W.T.(1989 The contro at the ASQC Fall Technical Con models,including proportional-integra -diferent erence,Ho ston,TX (PID)contr (see K NTER, aga (19 f Ou y18 ,pp.203-210, fective.We concluded tha in many HUNTER,J.S.(198)."A Point-Plot Equ nt to the Joural of Quality Technology Vol.26,No.2,April 1994

INTEGRATING STATISTICAL PROCESS CONTROL AND ENGINEERING PROCESS CONTROL MoN York.NY. 9 nic32.pp.1-12 MACGREGOR,J.F.(1987) KEATS,J.B. NTGON D. titute of Ch rs CAST New r,9-19 ol and Feed e谢84,pp.21-31 MACGREGOR,J.F.(1990)."A Di VANDER WEIL,S.i TuC 92%T J.F Control: cepts and an Application".Technometrics34 wcasandSarol Pp.2862 ci".Tec netrics 32.pp.23-26. Arion tate Univ MERY.D.C.:And Key Words: ( .C2 ss Control,Mini mum Mean Square Error Controller,Statistical Pro cess Control. Vol.26,No.2,April 1994 Jouralof Quality Technology
按次数下载不扣除下载券;
注册用户24小时内重复下载只扣除一次;
顺序:VIP每日次数-->可用次数-->下载券;
- 石河子大学:《质量管理与认证》课程授课教案(现代质量管理学,任课教师:欧亚明).doc
- 石河子大学:《质量管理与认证》课程教学大纲 Quality Control and Reliability(负责人:赵永满).doc
- 《餐饮实务实训》课程教学资源(案例)顽皮的珍宝蟹.doc
- 《餐饮实务实训》课程教学资源(案例)一瓶茅台酒白喝了.doc
- 《餐饮实务实训》课程教学资源(案例)向推销员推销.doc
- 《餐饮实务实训》课程教学资源(案例)我做错什么啦?.doc
- 《餐饮实务实训》课程教学资源(案例)餐厅满座了.doc
- 《餐饮实务实训》课程教学资源(案例)凌晨响起的预订电话.doc
- 《餐饮实务实训》课程教学资源(案例)客人为什么不愿付账.doc
- 《餐饮实务实训》课程教学资源(案例)杯子不够.doc
- 《餐饮实务实训》课程教学资源(案例)骨碟离桌边1.5厘米.doc
- 《餐饮实务实训》课程教学资源(案例)菜品档案.doc
- 《餐饮实务实训》课程教学资源(案例)“佛跳墙”是和尚创制的.doc
- 《餐饮实务实训》课程教学资源(案例)我给您上洗手盅.doc
- 《餐饮实务实训》课程教学资源(案例)被人抓住脖领的餐厅主管.doc
- 《餐饮实务实训》课程教学资源(案例)无形的力量.doc
- 《餐饮实务实训》课程教学资源(案例)客人并没有发觉.doc
- 《餐饮实务实训》课程教学资源(授课教案)餐饮实务实训电子教案.doc
- 《餐饮实务实训》课程教学课件(PPT讲稿)兰姆酒(Rum).ppt
- 《餐饮实务实训》课程教学课件(PPT讲稿)咖啡(Coffee).ppt
- 《质量管理与认证》课程教学资源(文献资料)JQT 1997-29-1-1-7 Control charts for quantile function values.pdf
- 《质量管理与认证》课程教学资源(文献资料)JQT 1997-29-1-16-20 A supplementary test based on the control chart for individuals.pdf
- 《质量管理与认证》课程教学资源(文献资料)JQT 1997-29-1-49-58 A unifying approach to process capability indices.pdf
- 《质量管理与认证》课程教学资源(文献资料)JQT 1997-29-1-8-15 Designing a multivariate EWMA control chart.pdf
- 《质量管理与认证》课程教学资源(文献资料)JQT 1997-29-1-21-40 Control charts applying a sequential test at fixed sampling intervals.pdf
- 《质量管理与认证》课程教学资源(文献资料)JQT 1997-29-1-41-48 An x and EWMA chart for individual observations.pdf
- 《质量管理与认证》课程教学资源(文献资料)JQT 1997-29-1-59-69 Optimal response surface designs in the presence of dispersion effects.pdf
- 《质量管理与认证》课程教学资源(文献资料)JQT 1997-29-1-71-75 Two-level factorial and fractional factorial designs in blocks of size two.pdf
- 《质量管理与认证》课程教学资源(文献资料)JQT 1997-29-1-76-85 Survey of software with mixture experiment capabilities.pdf
- 石河子大学:《质量管理与认证》课程教学资源(试卷习题)判断题(无答案).doc
- 石河子大学:《质量管理与认证》课程教学资源(试卷习题)简答题(无答案).doc
- 石河子大学:《质量管理与认证》课程教学资源(试卷习题)计算题(无答案).doc
- 石河子大学:《质量管理与认证》课程教学资源(试卷习题)选择题(无答案).doc
- 石河子大学:《质量管理与认证》课程教学资源(试卷习题)问答题(无答案).doc
- 石河子大学:《质量管理与认证》课程教学课件(PPT讲稿)第一章 绪论.ppt
- 石河子大学:《质量管理与认证》课程教学课件(PPT讲稿)第二章 现代质量理论中的基本概念.ppt
- 石河子大学:《质量管理与认证》课程教学课件(PPT讲稿)第三章质量管理体系标准.ppt
- 石河子大学:《质量管理与认证》课程教学课件(PPT讲稿)第五章 质量监督.ppt
- 石河子大学:《质量管理与认证》课程教学课件(PPT讲稿)第四章 质量审核和质量认证.ppt
- 石河子大学:《质量管理与认证》课程教学课件(PPT讲稿)第七章 质量管理中的应用技术和工具.ppt
