《质量管理与认证》课程教学资源(文献资料)JQT 1997-29-1-1-7 Control charts for quantile function values
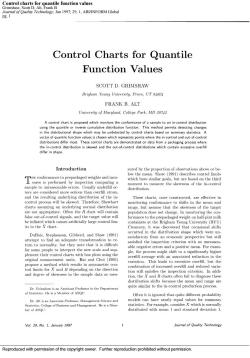
log:Jan 1997:29,1;ABI/INFORM Global Control Charts for Quantile Function Values SCOTT D.GRIMSHAW Brigham Young University.Prowo,UT 84604 FRANK B.ALT University of Maryland,College Park,MD 20742 eneoatoidstnbCtonTggeersngheotoconm02tudo5miah2otgr0gceeo8fm differ in shape. Introduction which have similar goals,but are based on the third sample to unreasonable errors.Usually underer moment to measure the skewness of the in-control osaecosid control process will he ske d Therefore Shewhart range,but assume that the skewness of the target eotoptioegi nals.and the target yalue will es not c e hatoccasionalshif and Shaw (1991 attempt to find an adcauate transformation to re satisfactory from an economic pers ective but still sa tisfied the inspection riterionwith no ureso to normality.but they note that it is difficu le the oc h shif highe original measurement units.Bai and Choi (1995) results i leads to ex but th and degree of skewness in the sample data as mea- tion criterion.In addi harts often tall to di e the Often it is ignored that quite different probability Dr.Alt is an Associate Professo models can have ne arly equal summa distributed with mean I and standard deviation 1. Vol.29.No.1.January199 1 Reproduced with permission of the copyright owner.Further reproduction prohibited without permission
Reproduced with permission of the copyright owner. Further reproduction prohibited without permission. Control charts for quantile function values Grimshaw, Scott D; Alt, Frank B Journal of Quality Technology; Jan 1997; 29, 1; ABI/INFORM Global pg. 1

SCOTT D.GRIMSHAW AND FRANK B.ALT and y which is exponentially distributed with mear ten the characteristics and pr 1.Both have equal means and standard deviations. ed using either moments or the probability den but t distrib di tion shapes as sho sity function. the quantile plots where it is po ossible to select values inverse cumulative dist Q(u)=F-1(u)={:F()=uh,01 This quantile function given by Parzen(1979).It app ars to behave better in small samples,which is often the o,than the piece The first step in constructing the control chart is unction whic -1 effective use of this control chart is when there are and the likely out-of-control distributions.Anothe nay be elect values of u that co (b) 02 04 06 08 For example,monitoring the box plots and Hoaglin (1987)c FIGURE 1.(a)Probability Density Functions and (b) nlot A third ann oach is to select values Quantile Functions for Normally Distributed X and Expo correspond to characteristics which are of most con nentially Distributed Y cern in the process.For example,if a change in th Journal of Quality Technology Vol.29.No.1.January 1997 Reproduced with permission of the copyright owner.Further reproduction prohibited without permission
Reproduced with permission of the copyright owner. Further reproduction prohibited without permission
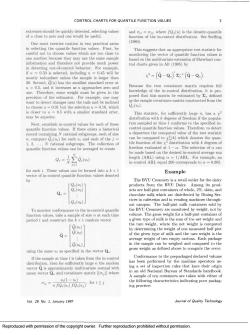
CONTROL CHARTS FOR QUANTILE FUNCTION VALUES extremes should be quickly detected,selecting values and ga=where fo (u)is the density-quantile of u close to zero and one would be useful. function of the in-control distribution.See Serfing One must exercise caution in two practical a 1980) in selecting the quantile function values.First,be This stic fo careful not to choose values which are too close fu b x2=(-Q)'1(-Q 20.Second,(u)has the smallest standard error at u -0.5,and it increases as u approaches zero and Because the true covariance matrix requires full knowledge of the in-control distribution ven to of the mated by 0,(u may be superior. of fre Therefore,to detec record containing y rational suberoups. each of size adeparture the computed he te compute (u)for each u and each of the j= hi freedom evaluted at 1-a.The selection of ca e mad ARL the desi control average ru in-control ARL equal 200 corresponds to =0.005. or for each i.These values can be formed into a k x I Example The bYu Cre a retail outlet for the dair 8.8 Among its prod- Q。= 02% skim,and oeonteafe LQo(u)] rias and in vendins ontainers sold by To monitor conformance to the in-control quantile mery are The weight.not女 Q(41) the tare w eight,where the net weight is Q(u2 of milk and the LQ(ME)] intheean ecartons.Each using the same as specified in the vectorQ Conformance to the pre ackaged declared volume has been performed by the r nachine operators ns have thei mean vectorQ。and covariance matrix【(oy】where A sample of ten containers are taken with either of the follo Vol.29.No.1.January 1997 Joural of Quality Technology Reproduced with permission of the copyright owner.Further reproduction prohibited without permission
Reproduced with permission of the copyright owner. Further reproduction prohibited without permission
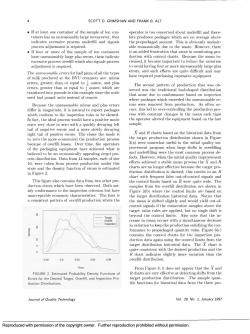
4 SCOTT D.GRIMSHAW AND FRANK B ALT .If at least one container of the sample of ten con- operator is too concerned about underfill and there ve proces the prepackaged amon .If four or more of the sample of ten containers isan added frustration that arose in monitoring pro duction with control charts.Because the mean in errors,and such efforts are quite difficult and may ave required purchasing expensive equipment. errors,greater than or equal toounce,and plus The second pattern of production that was ob due to confo where packages which exceeded the rors hi led from produc on. As oft en oc nale it is natural cess with constant changes in the mean each time and Rchart on the historical data to zero the more economical the production proces h time,the operators weroewauwehdinhenitialauai时y provement program when large shifts in overfilling und st common process de cess distribution.Data from 44 samples,each of size efforts achieved a stable mean process theand charts are no longer effective because the target pro in Figure 2. chart with frequent and This figure also R were quite wide.The isfy conformance to the inspection criterion but have on are shown in The the target distributio rical data.Notice tha the mean is shifted slightly and woul yield out- target value rules are applied.but no single shifti bevond the control limit Also note that the in formance to prepackaged quantity rules.Figure 3() contains the control charts for the pection pro quite consistent with the desired production and the R c 00 002 ao target production distribution.The sample quan duction Distributions. tile functions for historical data from the three pro oumal of Quality Technology Vol.29.No.1.January 1997 Reproduced with permission of the copyright owner.Further reproduction prohibited without permission
Reproduced with permission of the copyright owner. Further reproduction prohibited without permission
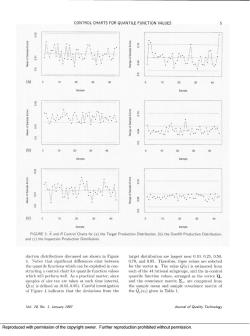
CONTROL CHARTS FOR QUANTILE FUNCTION VALUES ⊙ 20 30 Sample 20 30 40 20 30 c 0 20 30 0 0 0 20 30 40 FIGURE 3.X and RControl Charts for(a)the Target Production Distribution,(b)the Overfill Production Distribution. and (c)the Inspection Production Distribution duction distributions diseussed are shown in Figure target distribution are largest near 0.10.0.25.0.50 Notice t erences exis st between and 0.95 alue structing control chart for quntile function values each of the44 rational subgroups,and the in-control which will perform well.As a practical matter,since quantile function values,arranged as the vectorQ of Figure 4 indicates that the deviations from the and pe mean and sample covariance matrisof Vol.29,No.1.January 199 Journal of Quality Technology Reproduced with permission of the copyright owner.Further reproduction prohibited without permission
Reproduced with permission of the copyright owner. Further reproduction prohibited without permission
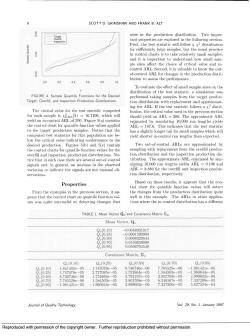
6 SCOTT D.GRIMSHAW AND FRANK B.ALT arise in the production distribution.Two impor- but the usual practice in control charts is to take relatively small samples d ir 0.0 04 performed taking samples from the target produc. ondetRiorw aCodanpPne The critical bution,the critical value used in the previous sectior trol ARL of 200.Fi ure 5(a)contains should yield an AR =200 The approximate A the control chart for quantile function values applied ARL =1476 This the to the target has a slightly longer tail for small samples which wil conformance to the yield shorter in-control run lengths than expected tion distribution and the inspe tice that in each case there are several out-of-control tribution sim ection tion distribution,respectively. Properties From the ev ples in the previous the。chart plica ues was quite successful at detecting changes that TABLE 1.Mean Vector Qo and Covariance Matrix o Mean Vector,Q 8 88 Covariance Matrix,。 0.0.101 0.10.251 00.50 0(0.70 00.95 41402e-05 17 -05 .746746e-0 .76552 -06 -1.981421e-05 80095 -1.981421e-05 -1.960644e-05 2.999602e-06 7.337200e-05 5.627524e-04 Journal of Quality Technology Vol.29.No.1,January 1997 Reproduced with permission of the copyright owner.Further reproduction prohibited without permission
Reproduced with permission of the copyright owner. Further reproduction prohibited without permission
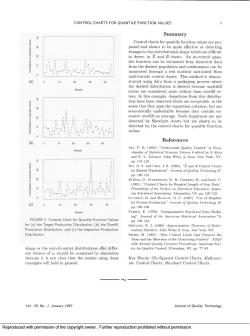
CONTROL CHARTS FOR QUANTILE FUNCTION VALUES Summary Control charts for quantile function values are pro cting to detect in and R charts.An in-control quan tile function can be estimated from historical data multivariate contro charts.This method is demon use u -6I errors are e critical tha rors.In this example.departures from this distribu- ion haveb which are acceptable.in the economically undesirable because they contain ex cessive overfill on average.Such departures are not values. 40 References ALT,F.B.(198. DUBoIs,D.:STEPHENSON,W.R.:.R.:and SHAW.C ria,VA.pp.120-125 (c) 0 10 20 30 40 ng". FIGURE 5.Controls Chart for Quantile Function Values ay for (a)the Target Production Distribution,(b)the Overfill SERFLING.R.1.(19)-Appr rimation Theorems of Mathe s.John Wiley So New York.NY shape or the out-of-control distributions offer differ. ent choices of u,should be examined by simulation Chi-So Vol.9,No.1.January 1997 Joural of Quality Technology Reproduced with permission of the copyright owner.Further reproduction prohibited without permission
Reproduced with permission of the copyright owner. Further reproduction prohibited without permission
按次数下载不扣除下载券;
注册用户24小时内重复下载只扣除一次;
顺序:VIP每日次数-->可用次数-->下载券;
- 《质量管理与认证》课程教学资源(文献资料)JQT 1994-26-2-79-87 integrating statistical process control and engineering process control.pdf
- 石河子大学:《质量管理与认证》课程授课教案(现代质量管理学,任课教师:欧亚明).doc
- 石河子大学:《质量管理与认证》课程教学大纲 Quality Control and Reliability(负责人:赵永满).doc
- 《餐饮实务实训》课程教学资源(案例)顽皮的珍宝蟹.doc
- 《餐饮实务实训》课程教学资源(案例)一瓶茅台酒白喝了.doc
- 《餐饮实务实训》课程教学资源(案例)向推销员推销.doc
- 《餐饮实务实训》课程教学资源(案例)我做错什么啦?.doc
- 《餐饮实务实训》课程教学资源(案例)餐厅满座了.doc
- 《餐饮实务实训》课程教学资源(案例)凌晨响起的预订电话.doc
- 《餐饮实务实训》课程教学资源(案例)客人为什么不愿付账.doc
- 《餐饮实务实训》课程教学资源(案例)杯子不够.doc
- 《餐饮实务实训》课程教学资源(案例)骨碟离桌边1.5厘米.doc
- 《餐饮实务实训》课程教学资源(案例)菜品档案.doc
- 《餐饮实务实训》课程教学资源(案例)“佛跳墙”是和尚创制的.doc
- 《餐饮实务实训》课程教学资源(案例)我给您上洗手盅.doc
- 《餐饮实务实训》课程教学资源(案例)被人抓住脖领的餐厅主管.doc
- 《餐饮实务实训》课程教学资源(案例)无形的力量.doc
- 《餐饮实务实训》课程教学资源(案例)客人并没有发觉.doc
- 《餐饮实务实训》课程教学资源(授课教案)餐饮实务实训电子教案.doc
- 《餐饮实务实训》课程教学课件(PPT讲稿)兰姆酒(Rum).ppt
- 《质量管理与认证》课程教学资源(文献资料)JQT 1997-29-1-16-20 A supplementary test based on the control chart for individuals.pdf
- 《质量管理与认证》课程教学资源(文献资料)JQT 1997-29-1-49-58 A unifying approach to process capability indices.pdf
- 《质量管理与认证》课程教学资源(文献资料)JQT 1997-29-1-8-15 Designing a multivariate EWMA control chart.pdf
- 《质量管理与认证》课程教学资源(文献资料)JQT 1997-29-1-21-40 Control charts applying a sequential test at fixed sampling intervals.pdf
- 《质量管理与认证》课程教学资源(文献资料)JQT 1997-29-1-41-48 An x and EWMA chart for individual observations.pdf
- 《质量管理与认证》课程教学资源(文献资料)JQT 1997-29-1-59-69 Optimal response surface designs in the presence of dispersion effects.pdf
- 《质量管理与认证》课程教学资源(文献资料)JQT 1997-29-1-71-75 Two-level factorial and fractional factorial designs in blocks of size two.pdf
- 《质量管理与认证》课程教学资源(文献资料)JQT 1997-29-1-76-85 Survey of software with mixture experiment capabilities.pdf
- 石河子大学:《质量管理与认证》课程教学资源(试卷习题)判断题(无答案).doc
- 石河子大学:《质量管理与认证》课程教学资源(试卷习题)简答题(无答案).doc
- 石河子大学:《质量管理与认证》课程教学资源(试卷习题)计算题(无答案).doc
- 石河子大学:《质量管理与认证》课程教学资源(试卷习题)选择题(无答案).doc
- 石河子大学:《质量管理与认证》课程教学资源(试卷习题)问答题(无答案).doc
- 石河子大学:《质量管理与认证》课程教学课件(PPT讲稿)第一章 绪论.ppt
- 石河子大学:《质量管理与认证》课程教学课件(PPT讲稿)第二章 现代质量理论中的基本概念.ppt
- 石河子大学:《质量管理与认证》课程教学课件(PPT讲稿)第三章质量管理体系标准.ppt
- 石河子大学:《质量管理与认证》课程教学课件(PPT讲稿)第五章 质量监督.ppt
- 石河子大学:《质量管理与认证》课程教学课件(PPT讲稿)第四章 质量审核和质量认证.ppt
- 石河子大学:《质量管理与认证》课程教学课件(PPT讲稿)第七章 质量管理中的应用技术和工具.ppt
- 石河子大学:《质量管理与认证》课程教学课件(PPT讲稿)第六章 企业质量管理.ppt
