《质量管理与认证》课程教学资源(文献资料)JQT 1997-29-1-16-20 A supplementary test based on the control chart for individuals

Asupplementary test based on the control chart for individuals anABUINFORM Global A Supplementary Test Based on the Control Chart for Individuals S.R.ADKE University of Pune,Pune-411007,Indi X.HONG Wright State University.Dayton, The conventional practice of employing the moving range chart(MR chart)as a companion chart to the()We here isa shift in the process variance.We conclude.on the basis of the relevant probabilities that the nhe MR chart6co3nu6n之 This test does no Introduction in the hter tine.Haw nique to detect shifts in the process variance.Ma ed that Gregorand (193)advocate the use e of the gopsesiqueatitaouradeiehL.Ho charts for the same practicalsi Crowder (19871 ted the ioiut the chart and the MR chart throug (i.e.using subgrouns of size one). cedure Wheeler and Chambers (1986)also recom use these stimate to control varia on the MR hart but not on the chart. in th mean an the ndivid servations are available. estioned the plotting of the MR ol chart cha oys moving ranges with a moving range chart (MR chart)of suc pretation.and (b) ai X ont≥2.of indiv D( some mensure of the sprend in -value Dr.Adke is a retired Profe rt.Their Mr.Hong is a graduate student. some conditional probabilities. of Qualiy Technology Vol.29.No.1.January 1997 Reproduced with permission of the copyright owner.Further reproduction prohibited without permission
Reproduced with permission of the copyright owner. Further reproduction prohibited without permission. A supplementary test based on the control chart for individuals Adke, S R; Hong, X Journal of Quality Technology; Jan 1997; 29, 1; ABI/INFORM Global pg. 16

A SUPPLEMENTARY TEST BASED ON THE CONTROL CHART FOR INDIVIDUALS 公 uation on the basis of only one out-of-control point e small vales of Qobtained by them are,indeed. not surprising. We.therefore.evaluate o when both x more realistic assut ptions Wethe 1993)und X,are out of contro We also i nvestigate the long. technique which can be used to diagnose shifts in the without plotting an additional chart. Pr[MR chart signals betweent+1 and+n Success and shifts in Process Variance X chart does not signal between t+1 and t+n. In the above definition of Q we have used time ing the conditional probability uently,of (1)is in our notation. Q=PrMR,signals and X,do not signall =Pr MR:>UCLMR or MR:<LCLMR LCLX<UCLXI. (1) We shall alsc evaluate the probability p tha andX.are there is a sigal nh chart between times+】 and (UCL ARL.of the chart and the other values of n ar chosen to be in the neighborhood of the ARL Schurink (1993)evaluated Qwhen h( Thus we consider e&oheaae and ignor ha the N(o.D distribution and has age.The main reason for this v n the e differenc the v(.2 dis listribution and X,has would usually be detected on the chart -X:which is resents the case when both v(a,2)aite the shif is in control and at time t.the proces 2 n.In short,and B are of interest mean shifts to level≠ while (iii)represents th only when there is a shift in the process variance. deviation by ctor f The cac 14 Roes,Doe and ()reveal that de of Wheeer and Chambers (96)and in turn afirm and Schurink (1993) that "their arguments against 4 for6=100.53 The method of comnutation i In our opinion hat of Roes, expect the MR chart to signal an out-of-control sit the parantheses are thos Vol.29.No.1.January 1997 Journal of Quality Technology Reproduced with permission of the copyright owner.Further reproduction prohibited without permission
Reproduced with permission of the copyright owner. Further reproduction prohibited without permission

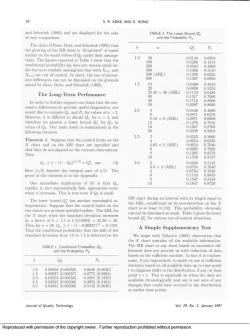
18 S.R.ADKE AND X.HONG and Schurink (1993)and are displayed for the sake of easy comparison. oand Schurink (1993)tha b Q: mainly on the small values of under their assu tions.The figure 1.0 0.0144 0.0953 ierdiomalprol ty2doesnotrepainualr 0.109 X+2 are out of control.In short.the use of succes 0150 D(0 sive differ 1.5 .06 033 The Long-Term Perfomance 25.38≈26(ARL) 0.1152 nodatorte5ppotorchimthathesc 8 would like to evaluate and P.for values of 2.0 However,it is difficult to obtain for n>2,and 8.18≈9(ARL the following theorem. 2.5 2 8 hat they d Then Qn≥1-(1-Q2)n/=Q,ay (3) 3.0 The 3.3≈4(ARL One immediate implication of (3)is that Q MR chart duri The lower bound O*has another meaningful in- hart is at least 0.1 52 bound for out-ofconrosituations lowe by a factor ofb=1.5is1/0.0394)=25.3826 Then for n= -0.0093 A Simple Supplementary Test We begin with Nelson's (1982)obs vation that the chart contains all the available information TABLE 1.Conditional Probability Q2 The MR chart or any chart based on successive dif and the Probability P2 some,if not impractical,to insist on use of sufficient ata up to time poin 0.000580.0005 0.00400.0020 point.This is when the datar 2 0.040010.00596 0.51420.3030 alaleoc the t cou Journal of Quality Technology Vol.29,No.1.January 1997 Reproduced with permission of the copyright owner.Further tion or hibited without permission
Reproduced with permission of the copyright owner. Further reproduction prohibited without permission

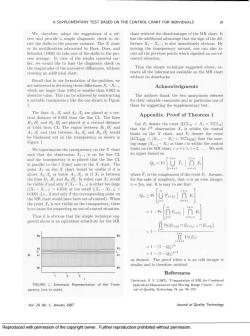
A SUPPLEMENTARY TEST BASED ON THE CONTROL CHART FOR INDIVIDUALS 19 We, tect the shifts in the process variance.The chart ference X. -X is also immediately obvious.By s in of the lier.we would like to base the diagnostic check on onal chart without its drawbacks. Recall that in our formulation of the problem.we are interested in Acknowledgments thank the two anont a movable transparency like the one shown in Figure for their in particular one of hem for suggesting the supplementary test. The lines A tical distance of002 from the line CL The line Appendix.Proof of Theorem 1 UCL Th nd thar be blackened out on the tranprency the even Figure 1 ng ra MR X X at time is within the ro the tra on the char limits on the MR chart,+.We seek an upper bound or Qn=PrUF∩E hart =41 4+】 above2.or below,or if is between where F,is the complement of the event F.Assume and either cas e X:woule 4.654)or too small ( 0.002)(ie.,if and only if the corresponding po t on he MR c ond have been out of control). suspecting an out-of control situation Ttsoinetheeteieqe =1-Pr门R+aTE ges ove Is al eql TI PrF20E+2-10E+2] 1- II Pr(E.) =1-(1-Q2)m =1-(1-Q2)n/2 as desired.The proof when n is an odd integer is similar and is therefore omitted. 2 References S.V (1987)."Computation of ARL for Combine FIGURE 1.Schematic Representation of the Trans parency(not to scale) Vol.29,No.1.January 1997 Journal of Quality Technology Reproduced with permission of the copyright owner.Further reproduction prohibited without permission
Reproduced with permission of the copyright owner. Further reproduction prohibited without permission

S.R.ADKE AND X.HONG 913.Pp228-23】 K.CB.Dos art-T WHFELER.D. and CHA pp. Mos D.C.(1 996).Introds sure ments".of Technology 14.pp.172-173 Journal of Quality Technology Vol.9.No.1.January 1997 Reproduced with permission of the copyright owner.Further reproduction prohibited without permission
Reproduced with permission of the copyright owner. Further reproduction prohibited without permission
按次数下载不扣除下载券;
注册用户24小时内重复下载只扣除一次;
顺序:VIP每日次数-->可用次数-->下载券;
- 《质量管理与认证》课程教学资源(文献资料)JQT 1997-29-1-1-7 Control charts for quantile function values.pdf
- 《质量管理与认证》课程教学资源(文献资料)JQT 1994-26-2-79-87 integrating statistical process control and engineering process control.pdf
- 石河子大学:《质量管理与认证》课程授课教案(现代质量管理学,任课教师:欧亚明).doc
- 石河子大学:《质量管理与认证》课程教学大纲 Quality Control and Reliability(负责人:赵永满).doc
- 《餐饮实务实训》课程教学资源(案例)顽皮的珍宝蟹.doc
- 《餐饮实务实训》课程教学资源(案例)一瓶茅台酒白喝了.doc
- 《餐饮实务实训》课程教学资源(案例)向推销员推销.doc
- 《餐饮实务实训》课程教学资源(案例)我做错什么啦?.doc
- 《餐饮实务实训》课程教学资源(案例)餐厅满座了.doc
- 《餐饮实务实训》课程教学资源(案例)凌晨响起的预订电话.doc
- 《餐饮实务实训》课程教学资源(案例)客人为什么不愿付账.doc
- 《餐饮实务实训》课程教学资源(案例)杯子不够.doc
- 《餐饮实务实训》课程教学资源(案例)骨碟离桌边1.5厘米.doc
- 《餐饮实务实训》课程教学资源(案例)菜品档案.doc
- 《餐饮实务实训》课程教学资源(案例)“佛跳墙”是和尚创制的.doc
- 《餐饮实务实训》课程教学资源(案例)我给您上洗手盅.doc
- 《餐饮实务实训》课程教学资源(案例)被人抓住脖领的餐厅主管.doc
- 《餐饮实务实训》课程教学资源(案例)无形的力量.doc
- 《餐饮实务实训》课程教学资源(案例)客人并没有发觉.doc
- 《餐饮实务实训》课程教学资源(授课教案)餐饮实务实训电子教案.doc
- 《质量管理与认证》课程教学资源(文献资料)JQT 1997-29-1-49-58 A unifying approach to process capability indices.pdf
- 《质量管理与认证》课程教学资源(文献资料)JQT 1997-29-1-8-15 Designing a multivariate EWMA control chart.pdf
- 《质量管理与认证》课程教学资源(文献资料)JQT 1997-29-1-21-40 Control charts applying a sequential test at fixed sampling intervals.pdf
- 《质量管理与认证》课程教学资源(文献资料)JQT 1997-29-1-41-48 An x and EWMA chart for individual observations.pdf
- 《质量管理与认证》课程教学资源(文献资料)JQT 1997-29-1-59-69 Optimal response surface designs in the presence of dispersion effects.pdf
- 《质量管理与认证》课程教学资源(文献资料)JQT 1997-29-1-71-75 Two-level factorial and fractional factorial designs in blocks of size two.pdf
- 《质量管理与认证》课程教学资源(文献资料)JQT 1997-29-1-76-85 Survey of software with mixture experiment capabilities.pdf
- 石河子大学:《质量管理与认证》课程教学资源(试卷习题)判断题(无答案).doc
- 石河子大学:《质量管理与认证》课程教学资源(试卷习题)简答题(无答案).doc
- 石河子大学:《质量管理与认证》课程教学资源(试卷习题)计算题(无答案).doc
- 石河子大学:《质量管理与认证》课程教学资源(试卷习题)选择题(无答案).doc
- 石河子大学:《质量管理与认证》课程教学资源(试卷习题)问答题(无答案).doc
- 石河子大学:《质量管理与认证》课程教学课件(PPT讲稿)第一章 绪论.ppt
- 石河子大学:《质量管理与认证》课程教学课件(PPT讲稿)第二章 现代质量理论中的基本概念.ppt
- 石河子大学:《质量管理与认证》课程教学课件(PPT讲稿)第三章质量管理体系标准.ppt
- 石河子大学:《质量管理与认证》课程教学课件(PPT讲稿)第五章 质量监督.ppt
- 石河子大学:《质量管理与认证》课程教学课件(PPT讲稿)第四章 质量审核和质量认证.ppt
- 石河子大学:《质量管理与认证》课程教学课件(PPT讲稿)第七章 质量管理中的应用技术和工具.ppt
- 石河子大学:《质量管理与认证》课程教学课件(PPT讲稿)第六章 企业质量管理.ppt
- 石河子大学:《质量管理与认证》课程教学课件(PPT讲稿)第九章 质量检验.ppt
