上海交通大学:《供应链管理 Supply Chain Management》课程教学资源(讲义资料)Experiments_Sample Reports_Beer Game_beer game 罗岩

上海文通大学 HANGHAI JIAO TONG UNIVERSITY Supply Chain Management 2013 Supply Chain Management-Beer Game 罗岩-1120329046-B1203292 Process of the Beer Game Data recordation and analysis Wee Cust Retailer Wholesaler Trader Manufacturer k ome Stor Short Or Stor Short Or Stor Short Or Stor Shor Pro r age age de age age de age age de age tage duc r r r e 0 0 0 0 4 0 1 14 0 1 10 0 1 10 1 0 5 10 0 5 8 0 6 8 0 7 2 5 2 0 8 4 0 4 0 5 10 0 0 5 9 0 5 10 0 4 e 0 6 7 0 3 9 4 9 0 5 10 1 0 0 5 0 5 9 5 9 0 3 10 0 8 3 0 7 2 0 6 9 0 1 10 0 6 9 3 0 7 3 0 5 7 9 0 3 10 0 2 14 2 0 7 6 0 5 9 0 5 10 0 5 20 0 2 12 0 5 9 9 0 1 9 0 2 14 0 7 20 2 0 3 10 9 0 4 10 0 3 6 0 13 12 0 5 5 11 9 0 1 10 0 2 9 0 7 10 0 17 9 12 6 1 0 5 0 2 9 0 1 10 0 7 10 13 6 2 0 0 10 0 6 15 0 1 10 14 6 2 0 5 2 0 8 0 4 15 0 0 10 15 6 4 0 2 0 0 > 0 1 15 0 5 15 16 6 3 0 3 0 0 7 2 0 10 0 5 15 17 6 2 0 5 7 0 5 0 7 0 0 20 18 6 1 0 12 0 0 8 0 5 0 10 19 6 0 3 10 14 0 0 20 0 0 18 0 0 20 6 0 2016 0 0 30 0 0 25 0 0 21 10 0 15 20 10 0 15 37 0 0 25 0 0 22 10 0 5 20 0 11 15 40 0 0 25 0 0 23 10 0 0 20 0 20 15 35 0 0 25 0 0 24 10 0 1 20 0 20 15 20 0 0 25 0 0 25 10 0 10 30 0 15 20 0 15 25 0 0 26 10 0 10 30 0 5 20 0 10 15 25 0 0 27 10 0 5 20 0 15 20 0 20 20 5 0 5 28 10 5 0 10 0 25 20 0 20 15 5 0 5 29 10 10 0 0 0 20 20 0 5 10 0 10 0 sheet 1 Data in the supply chain Page 1 Total 2
Supply Chain Management 2013 Page 1 Total 2 Supply Chain Management – Beer Game 罗岩 – 1120329046 - B1203292 Process of the Beer Game Data recordation and analysis Wee k Cust ome r Retailer Wholesaler Trader Manufacturer Stor age Short age Or de r Stor age Short age Or de r Stor age Short age Or de r Stor age Shor tage Pro duc e 0 0 0 0 4 0 1 14 0 1 10 0 1 10 1 5 0 5 10 0 5 8 0 6 8 0 7 5 2 5 2 0 8 4 0 4 0 5 10 0 0 5 3 9 0 5 10 0 4 8 0 6 7 0 3 9 4 9 0 5 10 1 0 5 6 0 5 0 5 9 5 9 0 3 10 0 7 8 3 0 7 2 0 7 6 9 0 1 10 0 6 9 3 0 7 3 0 5 7 9 0 3 10 0 2 14 2 0 7 6 0 5 8 9 0 5 10 0 5 20 0 2 12 4 0 5 9 9 0 1 9 0 2 14 0 7 20 2 0 3 10 9 0 4 10 0 3 8 0 13 12 0 5 5 11 9 0 1 10 0 2 9 0 7 10 0 17 9 12 6 1 0 5 0 2 9 0 1 10 0 7 10 13 6 2 0 5 0 3 10 0 6 15 0 1 10 14 6 2 0 5 2 0 8 0 4 15 0 0 10 15 6 4 0 2 0 0 7 0 1 15 0 5 15 16 6 3 0 3 0 0 7 2 0 10 0 5 15 17 6 2 0 5 7 0 3 5 0 7 0 0 20 18 6 1 0 5 12 0 0 8 0 3 5 0 10 19 6 0 3 10 14 0 0 20 0 0 18 0 0 20 6 0 7 20 16 0 0 30 0 0 25 0 0 21 10 0 15 20 10 0 15 37 0 0 25 0 0 22 10 0 5 20 0 11 15 40 0 0 25 0 0 23 10 0 0 20 0 20 15 35 0 0 25 0 0 24 10 0 1 20 0 20 15 20 0 0 25 0 0 25 10 0 10 30 0 15 20 5 0 15 25 0 0 26 10 0 10 30 0 5 20 0 10 15 25 0 0 27 10 0 5 20 0 15 20 0 20 20 5 0 5 28 10 5 0 10 0 25 20 0 20 15 5 0 5 29 10 10 0 0 0 20 20 0 5 10 0 10 0 sheet 1 Data in the supply chain

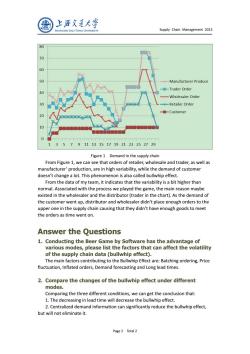
上海文通大学 SHANGHAI JIAO TONG UNIVERSITY Supply Chain Management 2013 80 70 60 50 Manufacturer Produce -Trader Order 40 -Wholesaler Order 30 米米 Retailer Order 量-Customer 20 10 腾 1357911131517192123252729 Figure 1 Demand in the supply chain From Figure 1,we can see that orders of retailer,wholesale and trader,as well as manufacturer'production,are in high variability,while the demand of customer doesn't change a lot.This phenomenon is also called bullwhip effect. From the data of my team,it indicates that the variability is a bit higher than normal.Associated with the process we played the game,the main reason maybe existed in the wholesaler and the distributor(trader in the chart).As the demand of the customer went up,distributor and wholesaler didn't place enough orders to the upper one in the supply chain causing that they didn't have enough goods to meet the orders as time went on. Answer the Questions 1.Conducting the Beer Game by Software has the advantage of various modes,please list the factors that can affect the volatility of the supply chain data(bullwhip effect). The main factors contributing to the Bullwhip Effect are:Batching ordering,Price fluctuation,Inflated orders,Demand forecasting and Long lead times. 2.Compare the changes of the bullwhip effect under different modes. Comparing the three different conditions,we can get the conclusion that: 1.The decreasing in lead time will decrease the bullwhip effect. 2.Centralized demand information can significantly reduce the bullwhip effect, but will not eliminate it. Page 2 Total 2
Supply Chain Management 2013 Page 2 Total 2 Figure 1 Demand in the supply chain From Figure 1, we can see that orders of retailer, wholesale and trader, as well as manufacturer’ production, are in high variability, while the demand of customer doesn’t change a lot. This phenomenon is also called bullwhip effect. From the data of my team, it indicates that the variability is a bit higher than normal. Associated with the process we played the game, the main reason maybe existed in the wholesaler and the distributor (trader in the chart). As the demand of the customer went up, distributor and wholesaler didn’t place enough orders to the upper one in the supply chain causing that they didn’t have enough goods to meet the orders as time went on. Answer the Questions 1. Conducting the Beer Game by Software has the advantage of various modes, please list the factors that can affect the volatility of the supply chain data (bullwhip effect). The main factors contributing to the Bullwhip Effect are: Batching ordering, Price fluctuation, Inflated orders, Demand forecasting and Long lead times. 2. Compare the changes of the bullwhip effect under different modes. Comparing the three different conditions, we can get the conclusion that: 1. The decreasing in lead time will decrease the bullwhip effect. 2. Centralized demand information can significantly reduce the bullwhip effect, but will not eliminate it

上海文通大¥ SHANGHAI JIAO TONG UNIVERSITY Supply Chain Management 2013 3.Make a comprehensive analysis for different modes and provide some suggestions for the case of Barilla SPA(A)in the text. The increase in variability in Barilla's supply chain is because that Barilla delivered product to Barilla's distributors on basis of whatever orders those distributors placed with the company.Barilla's customers were simply unwilling to give up their authority to place orders as they pleased.Some were even reluctant to provide the detailed sales data upon which Barilla could make delivery decisions and improve its demand forecast.Barilla can solve the increase in variability in supply chain by centralizing demand information,which can significantly reduce the bullwhip effect. Page 3 Total 2
Supply Chain Management 2013 Page 3 Total 2 3. Make a comprehensive analysis for different modes and provide some suggestions for the case of Barilla SPA(A) in the text. The increase in variability in Barilla’s supply chain is because that Barilla delivered product to Barilla’s distributors on basis of whatever orders those distributors placed with the company. Barilla’s customers were simply unwilling to give up their authority to place orders as they pleased. Some were even reluctant to provide the detailed sales data upon which Barilla could make delivery decisions and improve its demand forecast. Barilla can solve the increase in variability in supply chain by centralizing demand information, which can significantly reduce the bullwhip effect
按次数下载不扣除下载券;
注册用户24小时内重复下载只扣除一次;
顺序:VIP每日次数-->可用次数-->下载券;
- 上海交通大学:《供应链管理 Supply Chain Management》课程教学资源(讲义资料)Case Studies_SampleWork2013Spring_Wal-Mart_WalMartGroupDiscussion.docx
- 上海交通大学:《供应链管理 Supply Chain Management》课程教学资源(讲义资料)Case Studies_SampleWork2013Spring_Wal-Mart_Wal-Mart 罗岩.doc
- 上海交通大学:《供应链管理 Supply Chain Management》课程教学资源(讲义资料)Case Studies_SampleWork2013Spring_Wal-Mart_HWforweek12_金梦珂.docx
- 上海交通大学:《供应链管理 Supply Chain Management》课程教学资源(讲义资料)Case Studies_SampleWork2013Spring_Wal-Mart_case study5_杨健.docx
- 上海交通大学:《供应链管理 Supply Chain Management》课程教学资源(讲义资料)Case Studies_SampleWork2013Spring_Wal-Mart report_沃尔玛报告 罗岩.doc
- 上海交通大学:《供应链管理 Supply Chain Management》课程教学资源(讲义资料)Case Studies_SampleWork2013Spring_Wal-Mart report_WalMartReport陶鸿涛.docx
- 上海交通大学:《供应链管理 Supply Chain Management》课程教学资源(讲义资料)Case Studies_SampleWork2013Spring_Wal-Mart report_WalMart report_杨健.docx
- 上海交通大学:《供应链管理 Supply Chain Management》课程教学资源(讲义资料)Case Studies_SampleWork2013Spring_Wal-Mart report_Wal-Mart_金梦珂.docx
- 上海交通大学:《供应链管理 Supply Chain Management》课程教学资源(讲义资料)Case Studies_SampleWork2013Spring_RFID research plan_RFID.docx
- 上海交通大学:《供应链管理 Supply Chain Management》课程教学资源(讲义资料)Case Studies_SampleWork2013Spring_RFID research plan_RFID in parking lot research plan.docx
- 上海交通大学:《供应链管理 Supply Chain Management》课程教学资源(讲义资料)Case Studies_SampleWork2013Spring_RFID research plan_research plan.doc
- 上海交通大学:《供应链管理 Supply Chain Management》课程教学资源(讲义资料)Case Studies_SampleWork2013Spring_RFID research plan_research plan.doc
- 上海交通大学:《供应链管理 Supply Chain Management》课程教学资源(讲义资料)Case Studies_SampleWork2013Spring_RFID report_RFID report_金梦珂.docx
- 上海交通大学:《供应链管理 Supply Chain Management》课程教学资源(讲义资料)Case Studies_SampleWork2013Spring_RFID report_RFID report_杨健.docx
- 上海交通大学:《供应链管理 Supply Chain Management》课程教学资源(讲义资料)Case Studies_SampleWork2013Spring_RFID report_RFID Ensure Patients' Security-罗岩.doc
- 上海交通大学:《供应链管理 Supply Chain Management》课程教学资源(讲义资料)Case Studies_SampleWork2013Spring_RFID report_RFID Based Library Management System陶鸿涛.doc
- 上海交通大学:《供应链管理 Supply Chain Management》课程教学资源(讲义资料)Case Studies_SampleWork2013Spring_Meditech_Meditech罗岩.doc
- 上海交通大学:《供应链管理 Supply Chain Management》课程教学资源(讲义资料)Case Studies_SampleWork2013Spring_Meditech_Meditech_金梦珂.docx
- 上海交通大学:《供应链管理 Supply Chain Management》课程教学资源(讲义资料)Case Studies_SampleWork2013Spring_Meditech_Meditech 陶鸿涛.docx
- 上海交通大学:《供应链管理 Supply Chain Management》课程教学资源(讲义资料)Case Studies_SampleWork2013Spring_Meditech_case study1杨健.docx
- 上海交通大学:《供应链管理 Supply Chain Management》课程教学资源(讲义资料)Experiments_Sample Reports_Beer Game_Beer Game-金梦珂.docx
- 上海交通大学:《供应链管理 Supply Chain Management》课程教学资源(讲义资料)Experiments_Sample Reports_Beer Game_BeerGameReport_杨健.docx
- 上海交通大学:《供应链管理 Supply Chain Management》课程教学资源(讲义资料)Experiments_Sample Reports_Beer Game_BeerGameReport陶鸿涛.doc
- 上海交通大学:《供应链管理 Supply Chain Management》课程教学资源(讲义资料)Experiments_Sample Reports_Beer Game_beerGame_Report(贺艺).docx
- 上海交通大学:《供应链管理 Supply Chain Management》课程教学资源(讲义资料)Experiments_Sample Reports_Risk Pooling_Risk Pooling 罗岩.doc
- 上海交通大学:《供应链管理 Supply Chain Management》课程教学资源(讲义资料)Experiments_Sample Reports_Risk Pooling_RiskPoolExperimentReport.docx
- 上海交通大学:《供应链管理 Supply Chain Management》课程教学资源(讲义资料)Experiments_Sample Reports_Risk Pooling_riskpooling_金梦珂.docx
- 上海交通大学:《供应链管理 Supply Chain Management》课程教学资源(讲义资料)Group Work_GroupPresentationPPT_RFID & BARCODE.pptx
- 上海交通大学:《供应链管理 Supply Chain Management》课程教学资源(讲义资料)Group Work_GroupPresentationPPT_The application of RFID in cool chain.pptx
- 上海交通大学:《供应链管理 Supply Chain Management》课程教学资源(讲义资料)Group Work_Research Reports_RFID and Ticketing-Group Research.doc
- 上海交通大学:《供应链管理 Supply Chain Management》课程教学资源(讲义资料)Group Work_Research Reports_The application of RFID in cool chain.pdf
- 上海交通大学:《供应链管理 Supply Chain Management》课程教学资源(讲义资料)Group Work_合作学习指导手册.pdf
- 上海交通大学:《供应链管理 Supply Chain Management》课程教学资源(讲义资料)LectureNote(PostG)00-Introduction to Course(2012).pdf
- 上海交通大学:《供应链管理 Supply Chain Management》课程教学资源(讲义资料)LectureNote(PostG)01-Introduction to Supply Chain Management(2012).pdf
- 上海交通大学:《供应链管理 Supply Chain Management》课程教学资源(讲义资料)LectureNote(PostG)02-Inventory Management(1)(2012).pdf
- 上海交通大学:《供应链管理 Supply Chain Management》课程教学资源(讲义资料)LectureNote(PostG)02-Inventory Management(2)(2012).pdf
- 上海交通大学:《供应链管理 Supply Chain Management》课程教学资源(讲义资料)LectureNote(PostG)03_Logistics Network Configuration(2012).pdf
- 上海交通大学:《供应链管理 Supply Chain Management》课程教学资源(讲义资料)LectureNote(PostG)04-Supply Contracts(2012).pdf
- 上海交通大学:《供应链管理 Supply Chain Management》课程教学资源(讲义资料)LectureNote(PostG)05_The Value of Information(1)(2012).pdf
- 上海交通大学:《供应链管理 Supply Chain Management》课程教学资源(讲义资料)LectureNote(PostG)05_The Value of Information(2)(2012).pdf
