中国人民大学:《非参数统计》课程教学资源(教案讲义,综合版)第八章 非参数密度估计技术

Chap8非参数密度估计技术 参考:王星2009《非参数统计》 清华大学出版社 主讲:王星 助教:范超 中国人民大学统计学院 办公地点:明德主楼1019 办公电话:82500167 课程网站:https:/dm.ruc.edu.cn 2014年12月24日
Chap8 非参数密度估计技术 参考:王星2009《 非参数统计》 清华大学出版社 主讲:王 星 助教:范 超 中国人民大学统计学院 办公地点:明德主楼1019 办公电话:82500167 课程网站:https://dm.ruc.edu.cn 2014年12月24日

基本概念 ·想一想:什么是分布密度?分布密度有什么用? 色泽不均衡可能是催 熟西瓜 Zipf济普夫定律:在自然语言的 语料库里,一个单词出现的频率 与它在频率表里的排名成反比 分布密度和一个随机变量取值分布的均衡性有关系,不均衡 常常是世界的常态,语言学中重要的词一定被使用的频次高、 食品安全监测中的分布异常可能是风险的一个标志? 通过数据估计分布密度通常都有什么方法?
基本概念 • 想一想:什么是分布密度?分布密度有什么用? Zipf齐普夫定律:在自然语言的 语料库里,一个单词出现的频率 与它在频率表里的排名成反比 色泽不均衡可能是催 熟西瓜 分布密度和一个随机变量取值分布的均衡性有关系,不均衡 常常是世界的常态,语言学中重要的词一定被使用的频次高、 食品安全监测中的分布异常可能是风险的一个标志? 通过数据估计分布密度通常都有什么方法?

非参数密度估计 a直方图 Parzen Windows窗 Kernel density estimator 多元密度估计 判别分析
非参数密度估计 直方图 Parzen Windows窗 Kernel density estimator 多元密度估计 判别分析
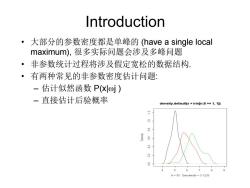
Introduction ·大部分的参数密度都是单峰的(have a single local maximum),很多实际问题会涉及多峰问题 ·非参数统计过程将涉及假定宽松的数据结构. ·有两种常见的非参数密度估计问题: -估计似然函数P(回j) -直接估计后验概率 density.default(x iris[n.s =1,1]) N=50 Bandwidth =0.1229
Introduction • 大部分的参数密度都是单峰的 (have a single local maximum), 很多实际问题会涉及多峰问题 • 非参数统计过程将涉及假定宽松的数据结构. • 有两种常见的非参数密度估计问题: – 估计似然函数 P(x|j ) – 直接估计后验概率
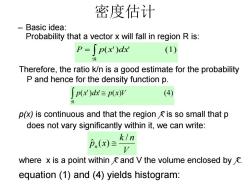
密度估计 -Basic idea: Probability that a vector x will fall in region R is: P=p(x')dx (1) Therefore,the ratio k/n is a good estimate for the probability P and hence for the density function p. p(x)dx'=p(x)v (4) p(x)is continuous and that the region is so small that p does not vary significantly within it,we can write: k/n Pn(x)≡ where x is a point within and V the volume enclosed by E. equation(1)and (4)yields histogram:
Therefore, the ratio k/n is a good estimate for the probability P and hence for the density function p. p(x) is continuous and that the region R is so small that p does not vary significantly within it, we can write: where x is a point within R and V the volume enclosed by R. equation (1) and (4) yields histogram: – Basic idea: Probability that a vector x will fall in region R is: 密度估计 ( ') ' ( ) (4) p x d x p x V P = p(x')d x' (1) V k n p x n / ˆ ( )
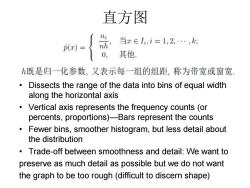
直方图 ni 当xeI,i=1,2,…,k 0, 其他 既是归一化参数,又表示每一组的组距,称为带宽或窗宽, Dissects the range of the data into bins of equal width along the horizontal axis Vertical axis represents the frequency counts(or percents,proportions)-Bars represent the counts Fewer bins,smoother histogram,but less detail about the distribution Trade-off between smoothness and detail:We want to preserve as much detail as possible but we do not want the graph to be too rough(difficult to discern shape)
直方图 • Dissects the range of the data into bins of equal width along the horizontal axis • Vertical axis represents the frequency counts (or percents, proportions)—Bars represent the counts • Fewer bins, smoother histogram, but less detail about the distribution • Trade-off between smoothness and detail: We want to preserve as much detail as possible but we do not want the graph to be too rough (difficult to discern shape)
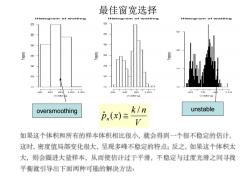
最佳窗宽选择 Histogram of waiting Histogram of weiting Histogram of walting 100120 100 11 waiting oversmoothing k/n unstable Pn(x) 如果这个体积和所有的样本体积相比很小,就会得到一个很不稳定的估计, 这时,密度值局部变化很大,呈现多峰不稳定的特点;反之,如果这个体积太 大,则会圈进大量样本,从而使估计过于平滑,不稳定与过度光滑之间寻找 平衡就引导出下而两种可能的解决方法:
V k n p x n / ˆ ( ) unstable oversmoothing 不 最佳窗宽选择
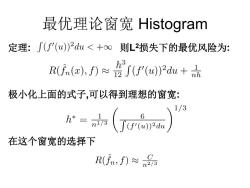
最优理论窗宽Histogram 定理:∫(∫'(u)2du<+o则L2损失下的最优风险为: rfn(x),f)≈jf'(u2a+ 极小化上面的式子,可以得到理想的窗宽: 1/3 =(Ta 在这个窗宽的选择下 R(f,f)≈nS
定理: 则L2损失下的最优风险为: 极小化上面的式子,可以得到理想的窗宽: 在这个窗宽的选择下 最优理论窗宽 Histogram
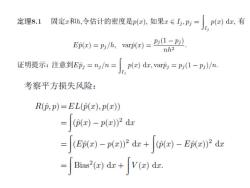
定理8.1 固定和h,令估计的密度是p,如果x∈马,=p)d,有 Ep(x)=Pi/h, apc)=P51-卫 nh2 证明提示:注意到E=nn= p()da,varpj pi(1-Pj)/n. 考察平方损失风险: R(p,p)=EL(p(x),p(x)) =(D(z)-p(z))2 dz -(Ep(=)-pz)dr+(p()-Epz))2 dzr =Bias()dr+v()回dk
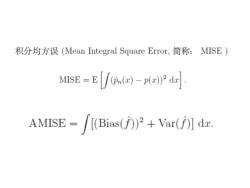
积分均方误(Mean Integral Square Error,简称:MISE) MISE-E(P(z)-p(z))2 dzr AMISE-[(Bias())+Var()dz
按次数下载不扣除下载券;
注册用户24小时内重复下载只扣除一次;
顺序:VIP每日次数-->可用次数-->下载券;
- 中国人民大学:《非参数统计》课程教学资源(教案讲义,综合版)第四章 多总体的统计检验.pdf
- 中国人民大学:《非参数统计》课程教学资源(教案讲义,综合版)第二章 单一样本的推断问题、第四章 两样本检验.pdf
- 中国人民大学:《非参数统计》课程教学资源(教案讲义,综合版)第一章 绪论.pdf
- 中国人民大学:《非参数统计》课程教学资源(教学大纲,主讲人:王星).pdf
- 中国科学技术大学:《应用回归分析》课程教学资源(课件讲义)第五章 自变量的选择与逐步回归.pdf
- 中国科学技术大学:《应用回归分析》课程教学资源(课件讲义)第四章 违背基本假设的情况.pdf
- 中国科学技术大学:《应用回归分析》课程教学资源(课件讲义)第三章 多元线性回归.pdf
- 中国科学技术大学:《应用回归分析》课程教学资源(课件讲义)第二章 一元线性回归.pdf
- 中国科学技术大学:《应用回归分析》课程教学资源(课件讲义)第一章 回归分析概述 Applied Regression Analysis.pdf
- 国家开放大学:2013—2014学年第一学期“开放专科”工商管理专业统计学原理期末试题(1月).pdf
- 国家开放大学:2011—2012学年第一学期“开放专科”金融专业统计学原理(B)期末试题(1月).pdf
- 国家开放大学:2011—2012学年第一学期“开放专科”工商管理专业统计学原理(B)期末试题(1月).pdf
- 国家开放大学:2010—2011学年第二学期“开放专科”金融专业统计学原理(B)期末试题(7月).pdf
- 唐山广播电视大学:《统计学原理》课程教学资源(试卷习题)试题类型及规范解答举例.doc
- 唐山广播电视大学:《统计学原理》课程教学资源(试卷习题)综合练习题及答案.doc
- 唐山广播电视大学:《统计学原理》课程教学资源(试卷习题)期末复习题及答案.doc
- 国家开放大学:2013—2014学年第一学期“开放专科”金融专业统计学原理期末试题(1月).pdf
- 《概率论与数理统计》课程教学资源(电子书)Introduction to Probability and Statistics with R(G. Jay Kerns,First Edition).pdf
- 中国科学技术大学:《概率论与数理统计》课程教学资源(试卷习题)期末考试2011.pdf
- 中国科学技术大学:《概率论与数理统计》课程教学资源(试卷习题)期末考试2010.pdf
- 中国人民大学:《非参数统计》课程教学资源(教案讲义,综合版)第六章 分类数据关联分析.pdf
- 中国人民大学:《非参数统计》课程教学资源(教案讲义,综合版)第六章 分类数据关联分析.pdf
- 中国人民大学:《非参数统计》课程教学资源(教案讲义,综合版)第八章 非参数回归.pdf
- 《统计学原理》课程教学资源(教材书籍)统计学 Statistics(第6版,中国人民大学出版社,编著:贾俊平、何晓群、金勇进)教材电子版.pdf
- 《统计学原理》课程教学资源(教材书籍)统计学 Statistics(第6版,中国人民大学出版社,编著:贾俊平)学习指导书.pdf
- 中国人民大学:《统计学原理》课程电子教案(第七版)第14章 指数.pdf
- 中国人民大学:《统计学原理》课程电子教案(第七版)第2章 数据的搜集.pdf
- 中国人民大学:《统计学原理》课程电子教案(第七版)第3章 数据的图表展示.pdf
- 中国人民大学:《统计学原理》课程电子教案(第七版)第4章 数据的概括性度量.pdf
- 中国人民大学:《统计学原理》课程电子教案(第七版)第5章 概率与概率分布.pdf
- 中国人民大学:《统计学原理》课程电子教案(第七版)第6章 统计量及其抽样分布.pdf
- 中国人民大学:《统计学原理》课程电子教案(第七版)第7章 参数估计.pdf
- 中国人民大学:《统计学原理》课程电子教案(第七版)第8章 假设检验.pdf
- 中国人民大学:《统计学原理》课程电子教案(第七版)第9章 分类数据分析.pdf
- 中国人民大学:《统计学原理》课程电子教案(第七版)第10章 方差分析.pdf
- 中国人民大学:《统计学原理》课程电子教案(第七版)第11章 一元线性回归.pdf
- 中国人民大学:《统计学原理》课程电子教案(第七版)第12章 多元线性回归.pdf
- 中国人民大学:《统计学原理》课程电子教案(第七版)第13章 时间序列分析和预测.pdf
- 中国人民大学:《统计学原理》课程电子教案(第七版)第1章 导论(统计学 STATISTICS).pdf
- 四川大学:数据统计分析软件SPSS入门(主讲:舒予).pdf
