电子科技大学:《生物医学信号处理 Biomedical Signal Processing》课程教学资源(课件讲稿)Lecture 6 Establishing Causality Bewteen Biomedical Signals
Lecture 6 Establishing Causality Between Biomedical Signals IEEE TRANSACTIONS ON BIOMEDICAL ENGINEERING,VOL.54,NO.12,pp.2214- 2222 DECEMBER 2007
Lecture 6 Establishing Causality Between Biomedical Signals IEEE TRANSACTIONS ON BIOMEDICAL ENGINEERING, VOL. 54, NO. 12, pp. 2214- 2222 DECEMBER 2007

I.INTRODUCTION Establishing causality is useful in many scientific and biomedical studies. (1)To determine whether nerve fibers are transmitting efferent or afferent information; (2)To identify and isolate the complicated web of influences on the autonomic nervous system; (3)To determine the source of neural activity in epileptic seizures [2];
I. INTRODUCTION • Establishing causality is useful in many scientific and biomedical studies. (1) To determine whether nerve fibers are transmitting efferent or afferent information; (2) To identify and isolate the complicated web of influences on the autonomic nervous system; (3) To determine the source of neural activity in epileptic seizures [2];
I.INTRODUCTION Establishing causality is useful in many scientific and biomedical studies. (4)To determine local field potential (LFP) propagation between brain structures in different behavioral states [3]; (5)To investigate electroencephalogram (EEG)activity propagation in different sleep stages[4]; (6)To describe interactions between cardiovascular and cardiorespiratory variability signals [5]-[7]
I. INTRODUCTION • Establishing causality is useful in many scientific and biomedical studies. (4) To determine local field potential (LFP) propagation between brain structures in different behavioral states [3]; (5) To investigate electroencephalogram (EEG) activity propagation in different sleep stages[4]; (6) To describe interactions between cardiovascular and cardiorespiratory variability signals [5]–[7]

I.INTRODUCTION There are many signal-processing and time-series analysis techniques for statistically characterizing the relationship between two stochastic processes. Cross-correlation analysis Transfer function estimation Parametric modeling Coherence analysis However,a few of techniques can be applied to determine whether there is a causal relationship between the two processes
I. INTRODUCTION • There are many signal-processing and time-series analysis techniques for statistically characterizing the relationship between two stochastic processes. Cross-correlation analysis Transfer function estimation Parametric modeling Coherence analysis However, a few of techniques can be applied to determine whether there is a causal relationship between the two processes

I.INTRODUCTION To determine whether there is a causal relationship. (1)Wiener recognized the importance of the temporal ordering in the inference of casual relations from a pure statistical point of view [8]. (2)Granger's causality measure based on vector autoregressive models [9]and improved Granger methods
I. INTRODUCTION To determine whether there is a causal relationship. (1) Wiener recognized the importance of the temporal ordering in the inference of casual relations from a pure statistical point of view [8]. (2) Granger’s causality measure based on vector autoregressive models [9] and improved Granger methods
I.INTRODUCTION Causality cannot generally be determined from Signal analysis alone; However,we may be able to statistically distinguish between several possible causal relationships with cross-correlation analysis
I. INTRODUCTION Causality cannot generally be determined from Signal analysis alone; However, we may be able to statistically distinguish between several possible causal relationships with cross-correlation analysis
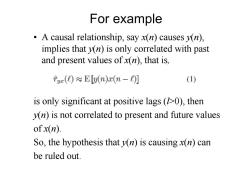
For example A causal relationship,say x(n)causes v(n), implies that y(n)is only correlated with past and present values ofx(n),that is, fa()≈E[n)x(n-)] (1) is only significant at positive lags (10),then v(n)is not correlated to present and future values ofx(n). So,the hypothesis that y(n)is causing x(n)can be ruled out
For example • A causal relationship, say x(n) causes y(n), implies that y(n) is only correlated with past and present values of x(n), that is, is only significant at positive lags (l>0), then y(n) is not correlated to present and future values of x(n). So, the hypothesis that y(n) is causing x(n) can be ruled out
I.INTRODUCTION However,if the processes are correlated at both positive and negative lags,then the processes do not have a clear causal relationship and we cannot make any conclusions. Unfortunately,this often occurs even when the processes are known to have a simple causal relationship
I. INTRODUCTION • However, if the processes are correlated at both positive and negative lags, then the processes do not have a clear causal relationship and we cannot make any conclusions. • Unfortunately, this often occurs even when the processes are known to have a simple causal relationship
The exsiting causality analysis methods (1)Wiener's pure statistical point of view [8]. (2)Granger's causality measure based on vector auto regressive models. (3)Saito decomposed coherence into two directed coherencies. (4)Baccala introduced partial directed coherence based on Saito's directed coherence(DC). (5)Kaminski proposed a multivariate spectral measure called the directed transfer function (DTF)[12]. (6)Group delay
The exsiting causality analysis methods (1) Wiener’s pure statistical point of view [8]. (2) Granger’s causality measure based on vector auto regressive models. (3) Saito decomposed coherence into two directed coherencies. (4) Baccala introduced partial directed coherence based on Saito’s directed coherence(DC). (5) Kaminski proposed a multivariate spectral measure called the directed transfer function (DTF)[12]. (6) Group delay

About the delay method The statistically model of the signals: x(n)=s(n)+v(n) (2) y(n)=As(n-d)+w(n) (3) x(n),y(n):observed signals; v(n),w(n):mutually uncorrelated white noise processes. s(n):original signal.d:the delay of interest
About the delay method • The statistically model of the signals: x(n) , y(n): observed signals; v(n),w(n): mutually uncorrelated white noise processes. s(n): original signal. d: the delay of interest
按次数下载不扣除下载券;
注册用户24小时内重复下载只扣除一次;
顺序:VIP每日次数-->可用次数-->下载券;
- 电子科技大学:《生物医学信号处理 Biomedical Signal Processing》课程教学资源(课件讲稿)Lecture 5.2 Biomedical Applications of Kalman Filter.pdf
- 电子科技大学:《生物医学信号处理 Biomedical Signal Processing》课程教学资源(课件讲稿)Lecture 5.1 卡尔曼滤波器 Kalman Filter.pdf
- 电子科技大学:《生物医学信号处理 Biomedical Signal Processing》课程教学资源(课件讲稿)Lecture 4.2 biomedical Applications of AR Model.pdf
- 电子科技大学:《生物医学信号处理 Biomedical Signal Processing》课程教学资源(课件讲稿)Lecture 4.1 Parametric Model Method.pdf
- 电子科技大学:《生物医学信号处理 Biomedical Signal Processing》课程教学资源(课件讲稿)Lecture 3 Adaptive Wiener Filter and Biomedical Applications.pdf
- 电子科技大学:《生物医学信号处理 Biomedical Signal Processing》课程教学资源(课件讲稿)Lecture 2 Classical Power Spectral Estimation Methods and Biomedical Applications.pdf
- 电子科技大学:《生物医学信号处理 Biomedical Signal Processing》课程教学资源(课件讲稿)Lecture 1 Introduction(饶妮妮).pdf
- 电子科技大学:《生物医学信号处理 Biomedical Signal Processing》课程教学资源(案例教学)心电信号处理.pdf
- 电子科技大学:《生物医学信号处理 Biomedical Signal Processing》课程教学资源(案例教学)脑电信号处理(格兰杰因果关系及其在脑电中的应用).pdf
- 电子科技大学:《生物医学信号处理 Biomedical Signal Processing》课程教学资源(案例教学)基因组信号处理.pdf
- 电子科技大学:《生物医学信号处理 Biomedical Signal Processing》课程教学资源(案例教学)蛋白质信号处理 Deep-Kcr - accurate detection of lysine crotonylation sites using deep learning method.pdf
- 电子科技大学:《生物医学信号处理 Biomedical Signal Processing》课程教学资源(教学大纲,饶妮妮).pdf
- 西藏农牧学院:《动物生物化学 Animal biochemistry》课程教学资源(电子教案,杨晓梅).pdf
- 西藏农牧学院:《动物生物化学 Animal biochemistry》课程教学资源(教学大纲,本科).pdf
- 西藏农牧学院:《动物生物化学 Animal biochemistry》课程教学资源(教学大纲,大专).pdf
- 惠州学院:《基础生物学》课程教学资源(实验讲义)河蚌(或田螺)的解剖.pdf
- 惠州学院:《基础生物学》课程教学资源(实验讲义)蛔虫和环毛蚓的比较.pdf
- 河南大学:《生物化学》课程教学资源(教案讲义)第二十二章 癌基因与抑癌基因(Oncogene and anti-oncogene).pdf
- 河南大学:《生物化学》课程教学资源(教案讲义)第二十一章 细胞通讯与细胞信号转导的分子机理 Cell Communication and Cell Signal Transduction.pdf
- 河南大学:《生物化学》课程教学资源(教案讲义)第二十章 DNA重组与基因工程 DNARecombination and Genetic engineering.pdf
- 电子科技大学:《生物医学信号处理 Biomedical Signal Processing》课程教学资源(课件讲稿)Lecture 7 Multivariate Signal Processing and Biomedical Applications.pdf
- 电子科技大学:《生物医学信号处理 Biomedical Signal Processing》课程教学资源(参考文献)Time-Frequency Analysis(Kernel nonnegative matrix factorization for spectral EEG feature extraction).pdf
- 电子科技大学:《生物医学信号处理 Biomedical Signal Processing》课程教学资源(课件讲稿)Lecture 8.1 Time-frequency analysis - Short Time Fourier Transformation(STFT).pdf
- 电子科技大学:《生物医学信号处理 Biomedical Signal Processing》课程教学资源(课件讲稿)Lecture 8.2 Time-Frequency Analysis - Wavelet Analysis 小波分析.pdf
- 电子科技大学:《神经信息学基础 The Basis of Neuroinformatics》研究生课程教学资源(课件讲稿)绪论(李永杰、夏阳).pdf
- 电子科技大学:《神经信息学基础 The Basis of Neuroinformatics》研究生课程教学资源(课件讲稿)第1章 生物神经系统的结构基础.pdf
- 电子科技大学:《神经信息学基础 The Basis of Neuroinformatics》研究生课程教学资源(课件讲稿)第2章 神经信息传导的生理基础.pdf
- 电子科技大学:《神经信息学基础 The Basis of Neuroinformatics》研究生课程教学资源(课件讲稿)第3章 视觉的神经机制与计算模型(3.1-3.3).pdf
- 电子科技大学:《神经信息学基础 The Basis of Neuroinformatics》研究生课程教学资源(课件讲稿)第3章 视觉的神经机制与计算模型(3.4-3.5).pdf
- 电子科技大学:《神经信息学基础 The Basis of Neuroinformatics》研究生课程教学资源(课件讲稿)第3章 视觉的神经机制与计算模型(3.6)视觉系统中的串行与平行处理机制.pdf
- 电子科技大学:《神经信息学基础 The Basis of Neuroinformatics》研究生课程教学资源(课件讲稿)第3章 视觉的神经机制与计算模型(3.7)选择性注意机制与模型.pdf
- 电子科技大学:《神经信息学基础 The Basis of Neuroinformatics》研究生课程教学资源(课件讲稿)第3章 视觉的神经机制与计算模型(3.8-3.9).pdf
- 电子科技大学:《神经信息学基础 The Basis of Neuroinformatics》研究生课程教学资源(课件讲稿)第4章 眼动 Eye movements(4.1-4.4).pdf
- 电子科技大学:《神经信息学基础 The Basis of Neuroinformatics》研究生课程教学资源(课件讲稿)第4章 眼动 Eye movements(4.5)眼动跟踪技术的应用领域.pdf
- 电子科技大学:《神经信息学基础 The Basis of Neuroinformatics》研究生课程教学资源(课件讲稿)第5章 脑电 EEG/ERP(5.1-5.2).pdf
- 电子科技大学:《神经信息学基础 The Basis of Neuroinformatics》研究生课程教学资源(课件讲稿)第5章 脑电 EEG/ERP(5.3-5.4).pdf
- 电子科技大学:《神经信息学基础 The Basis of Neuroinformatics》研究生课程教学资源(课件讲稿)第6章 脑机接口 Brain-Computer Interfaces - BCI(6.1-6.3).pdf
- 电子科技大学:《神经信息学基础 The Basis of Neuroinformatics》研究生课程教学资源(课件讲稿)第6章 脑机接口 Brain-Computer Interfaces - BCI(6.4)Challenges & Future.pdf
- 《金陵科技学院学报》:中国安息香属植物的形态特征及自然地理分布.pdf
- 甘肃农业大学:生物技术专业教学计划(植物).pdf
