上海交通大学:《系统思考与科学决策 Systems Thinking and Scientific Decision-making》课程教学资源(讲义)Lecture 2 System Dynamics(2/2)
System Dynamics ll Huang Dan 7 March,2017 上游充通大¥ Shanghai Jiao Tong University
System Dynamics II Huang Dan 7 March, 2017

Final Group Assignment Requirements: Refer to course ftp site Logistics: Submit your team members March 21 Final presentation May 2
Final Group Assignment Requirements: Refer to course ftp site Logistics: • Submit your team members March 21 • Final presentation May 2
Last Class Project problems viewed dynamically Understanding dynamics:the system dynamics methodology
Last Class Project problems viewed dynamically Understanding dynamics: the system dynamics methodology
System Dynamics Viewpoint While external events are a fact of life on projects,project performance problems are fundamentally dynamic problems that result from attempts to manage in face of change and uncertainty. 5
5 System Dynamics Viewpoint While external events are a fact of life on projects, project performance problems are fundamentally dynamic problems that result from attempts to manage in face of change and uncertainty
What Causes Dynamics? All dynamics are driven by Accumulation processes Feedback processes 6
6 What Causes Dynamics? All dynamics are driven by – Accumulation processes Feedback processes

Stock 又 inflow outflaw 7
7
What Causes Dynamics? All dynamics are driven by -Accumulation processes Feedback processes 8
8 What Causes Dynamics? All dynamics are driven by – Accumulation processes Feedback processes
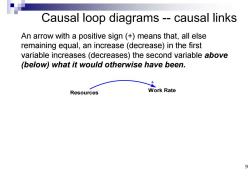
Causal loop diagrams--causal links An arrow with a positive sign (+)means that,all else remaining equal,an increase(decrease)in the first variable increases(decreases)the second variable above (below)what it would otherwise have been. Resources Work Rate 9
Causal loop diagrams -- causal links An arrow with a positive sign (+) means that, all else remaining equal, an increase (decrease) in the first variable increases (decreases) the second variable above (below) what it would otherwise have been. Resources Work Rate + 9
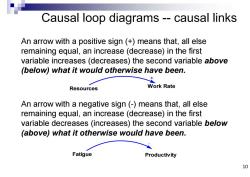
Causal loop diagrams--causal links An arrow with a positive sign (+)means that,all else remaining equal,an increase (decrease)in the first variable increases(decreases)the second variable above (below)what it would otherwise have been. Resources Work Rate An arrow with a negative sign(-)means that,all else remaining equal,an increase (decrease)in the first variable decreases (increases)the second variable below (above)what it otherwise would have been. Fatigue Productiv ity 10
Causal loop diagrams -- causal links An arrow with a positive sign (+) means that, all else remaining equal, an increase (decrease) in the first variable increases (decreases) the second variable above (below) what it would otherwise have been. An arrow with a negative sign (-) means that, all else remaining equal, an increase (decrease) in the first variable decreases (increases) the second variable below (above) what it otherwise would have been. Resources Work Rate + Fatigue Productivity - 10
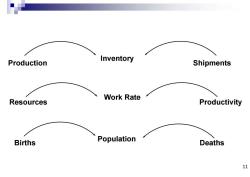
Inventory Production Shipments Work Rate Resources Productivity Births Population Deaths 11
Inventory Production Shipments Work Rate Resources Productivity Population Births Deaths 11
按次数下载不扣除下载券;
注册用户24小时内重复下载只扣除一次;
顺序:VIP每日次数-->可用次数-->下载券;
- 上海交通大学:《系统思考与科学决策 Systems Thinking and Scientific Decision-making》课程教学资源(讲义)Lecture 2 System Dynamics(1/2).pdf
- 上海交通大学:《系统思考与科学决策 Systems Thinking and Scientific Decision-making》课程教学资源(讲义)Lecture 1 Systems Thinking and Scientific Decision-making.pdf
- 上海交通大学:《治理之善:公共行政热点解析》课程教学资源(PPT课件讲稿)课程介绍(主讲:章伟).pptx
- 上海交通大学:《治理之善:公共行政热点解析》课程教学资源(PPT课件讲稿)绪论 从管理到治理:从“上海交通大治”谈起.pptx
- 上海交通大学:《治理之善:公共行政热点解析》课程教学资源(PPT课件讲稿)结语 善治与治善:寻找政府正义之门.pptx
- 上海交通大学:《治理之善:公共行政热点解析》课程教学资源(PPT课件讲稿)专题四 多中心治理:中国式蜗居何时了.pptx
- 上海交通大学:《治理之善:公共行政热点解析》课程教学资源(PPT课件讲稿)专题六 协商治理:医患纠纷破解之道.pptx
- 上海交通大学:《治理之善:公共行政热点解析》课程教学资源(PPT课件讲稿)专题五 自组织治理:空巢老人,不该如此死去.pptx
- 上海交通大学:《治理之善:公共行政热点解析》课程教学资源(PPT课件讲稿)专题二 整体性治理:12345与最多跑一次.pptx
- 上海交通大学:《治理之善:公共行政热点解析》课程教学资源(PPT课件讲稿)专题三 合作治理:校园暴力化解之道.pptx
- 上海交通大学:《治理之善:公共行政热点解析》课程教学资源(PPT课件讲稿)专题一 新公共管理:监狱民营化.pptx
- 上海交通大学:《治理之善:公共行政热点解析》课程教学资源(阅读资料)教育部等九部门关亍防治中小学生欺凌和暴力的指导意见.pdf
- 上海交通大学:《治理之善:公共行政热点解析》课程教学资源(阅读资料)上海市医患纠纷预防与调解办法(沪府令12号).docx
- 上海交通大学:《治理之善:公共行政热点解析》课程教学资源(阅读资料)上海市医患纠纷人民调解工作实施办法.docx
- 《西方文化》课程教学资源(参考书籍)现代西方学术文库《新教伦理与资本主义精神》(马克斯·韦伯,上下篇共五章).pdf
- 《西方文化》课程教学资源(参考书籍)人民文学出版社《莎士比亚全集》PDF电子书(五).pdf
- 《西方文化》课程教学资源(参考书籍)世界名著百部(海明威)《老人与海 THE OLD MAN AND THE SEA》.pdf
- 《西方文化》课程教学资源(参考书籍)世界文学名著百部《悲惨世界》(著【法】雨果).pdf
- 《西方文化》课程教学资源(参考书籍)外国文学名著丛书《失乐园》(弥尔顿,译文1984,共十二卷).pdf
- 《西方文化》课程教学资源(参考书籍)历代基督教经典思想文库([德]康德)《单纯理性限度内的宗教》.pdf
- 上海交通大学:《系统思考与科学决策 Systems Thinking and Scientific Decision-making》课程教学资源(讲义)Lecture 4 More causal diagrams and modes of behaviors.pdf
- 上海交通大学:《系统思考与科学决策 Systems Thinking and Scientific Decision-making》课程教学资源(讲义)Lecture 5 Leverage Points – what is the real problem?.pdf
- 上海交通大学:《系统思考与科学决策 Systems Thinking and Scientific Decision-making》课程教学资源(讲义)Lecture 6 The Market that Plays.pdf
- 上海交通大学:《系统思考与科学决策 Systems Thinking and Scientific Decision-making》课程教学资源(讲义)Lecture 8 Insight into Beer Game & Beyond.pdf
- 《社会科学研究方法》课程教学资源:2010年中国妇女社会地位调查问卷(流动).pdf
- 《社会科学研究方法》课程教学资源:SPSS Datasets(GSS ESG)General Social Survey——Cycle 24:Time-Stress and Well-Being Questionnaire.pdf
- 《社会科学研究方法》课程教学资源:SPSS Software_PASW Statistics 17(SPSS 17)Part 1:Descriptive Statistics.pdf
- 《社会科学研究方法》课程教学资源:SPSS Software_Statistics-Spss Guide For Dummies.pdf
- 《社会科学研究方法》课程教学资源:SPSS Software_Upenn_2009- The Very Basics of SPSS.pdf
- 《社会科学研究方法》课程教学资源(阅读材料)Reflections on Choosing the Appropriate Level of Abstraction in Social Science Research.pdf
- 《社会科学研究方法》课程教学资源(阅读材料“中国式”邻避运动核心议题探析———基于民意视角(上海交通大学:王奎明、钟杨).pdf
- 《社会科学研究方法》课程教学资源(阅读材料)“幸福悖论”的积极心理学思考——我们如何更加幸福.pdf
- 《社会科学研究方法》课程教学资源(阅读材料)中国农民工工资走势(1979-2010).pdf
- 《社会科学研究方法》课程教学资源(阅读材料)中国城乡居民的教育机会不平等及其演变(1978—2008).pdf
- 《社会科学研究方法》课程教学资源(阅读材料)中国政府购买社会组织公共服务现状分析.pdf
- 《社会科学研究方法》课程教学资源(阅读材料)哈尔滨话合口呼零声母[υ]化的社会语言学研究.pdf
- 《社会科学研究方法》课程教学资源(阅读材料)大学毕业生“啃老”现象原因探析.pdf
- 《社会科学研究方法》课程教学资源(阅读材料)大学生生活习惯对自我肯定意识的影响.pdf
- 《社会科学研究方法》课程教学资源(阅读材料)如何走出个案——从个案研究到扩展个案研究.pdf
- 《社会科学研究方法》课程教学资源(阅读材料)如何走出个案——从个案研究到扩展个案研究.pdf
