同济大学:《经济学》课程教学资源(教案讲义)Ch14 Outputs and Money Market - IS-LM Model
1907 Ch14 Outputs and Money Market: IS-LM Model Economics ECONOMICS MANAGEMENT SCHOOL,TONGJI UNIVERSITY
Economics ECONOMICS & MANAGEMENT SCHOOL, TONGJI UNIVERSITY Ch14 Outputs and Money Market: IS-LM Model
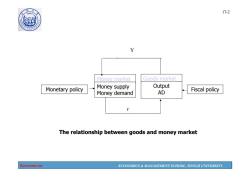
190 17-2 例 Money market Goods market Monetary policy Money supply Output Fiscal policy Money demand AD r The relationship between goods and money market Economics ECONOMICS MANAGEMENT SCHOOL,TONGJI UNIVERSITY
Economics ECONOMICS & MANAGEMENT SCHOOL, TONGJI UNIVERSITY 17-2 Monetary policy Money market Money supply Money demand Y r Goods market Output AD Fiscal policy The relationship between goods and money market

490 17-3 ④ 14.1 The IS curve def:a graph of all combinations of r and y that result in goods market equilibrium, i.e.actual expenditure (output)=planned expenditure The equation for the Is curve is: Y=C(Y-T)+I(r)+G I(r)=Io-er Economics ECONOMICS MANAGEMENT SCHOOL,TONGJI UNIVERSITY
Economics ECONOMICS & MANAGEMENT SCHOOL, TONGJI UNIVERSITY 17-3 14.1 The IS curve def: a graph of all combinations of r and Y that result in goods market equilibrium, i.e. actual expenditure (output) = planned expenditure The equation for the IS curve is: Y CY T I r G ( ) () I(r ) =I 0 -er
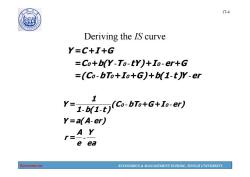
17-4 0 ④ Deriving the IS curve Y=C+I+G =Co+b(Y-To-tY)+Io-er+G =(Co-bTo+To+G)+b(1-t)Y-er 1 Y-1(1(Co-bTo+G+Io-er) Y=a(A-er) AY r= e ea Economics ECONOMICS MANAGEMENT SCHOOL,TONGJI UNIVERSITY
Economics ECONOMICS & MANAGEMENT SCHOOL, TONGJI UNIVERSITY 17-4 Deriving the IS curve (C bT I G) b(1 t )Y er C b(Y T tY) I er G Y C I G 0 0 0 0 0 0 - - - - - - = + + + = + + + = + + ea Y e A r Y a(A er) (C bT G I er) 1 b(1 t ) 1 Y 0 0 0 - - - - - - = = = + +
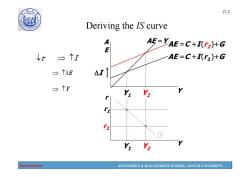
1907 17-5 Deriving the IS curve w AE=YAE-C+I(r2)+G ↓r台个I AE=C+I)+G →个AE △I Yi Y2 2 IS Y Y2 Economics ECONOMICS MANAGEMENT SCHOOL,TONGJI UNIVERSITY
Economics ECONOMICS & MANAGEMENT SCHOOL, TONGJI UNIVERSITY 17-5 Y1 Y2 Y1 Y2 Deriving the IS curve r I Y A E r Y AE =C +I (r1)+G AE =C +I (r2)+G r1 r2 AE =Y IS AE I Y
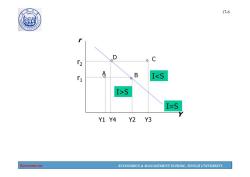
190 17-6 D C B IS I-S Y1 Y4 Y2 Y3 Economics ECONOMICS MANAGEMENT SCHOOL,TONGJI UNIVERSITY
Economics ECONOMICS & MANAGEMENT SCHOOL, TONGJI UNIVERSITY 17-6 r Y A B D C Y1 Y2 Y3 Y4 r1 r2 IS I=S
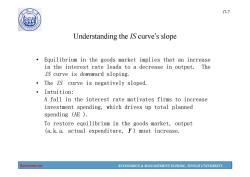
190 17-7 Understanding the IS curve's slope Equilibrium in the goods market implies that an increase in the interest rate leads to a decrease in output.The IS curve is downward sloping. The Is curve is negatively sloped. ·Intuition: A fall in the interest rate motivates firms to increase investment spending,which drives up total planned spending (AE). To restore equilibrium in the goods market,output (a.k.a.actual expenditure,r)must increase. Economics ECONOMICS MANAGEMENT SCHOOL,TONGJI UNIVERSITY
Economics ECONOMICS & MANAGEMENT SCHOOL, TONGJI UNIVERSITY 17-7 Understanding the IS curve’s slope • Equilibrium in the goods market implies that an increase in the interest rate leads to a decrease in output. The IS curve is downward sloping. • The IS curve is negatively sloped. • Intuition: A fall in the interest rate motivates firms to increase investment spending, which drives up total planned spending (AE ). To restore equilibrium in the goods market, output (a.k.a. actual expenditure, Y ) must increase
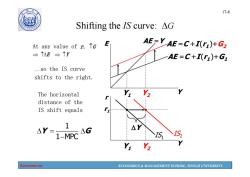
17-8 Shifting the IS curve:AG At any value of r,↑G AE=Y AE=C+I(r)+G2 →个AE三个Y AE=C+I()+G ...so the IS curve shifts to the right. The horizontal Y2 distance of the IS shift equals 1 △Y= ΔG 1-MPC IS Y Y2 Economics ECONOMICS MANAGEMENT SCHOOL,TONGJI UNIVERSITY
Economics ECONOMICS & MANAGEMENT SCHOOL, TONGJI UNIVERSITY 17-8 Y1 Y2 Y1 Y2 Shifting the IS curve: G At any value of r, G AE Y Y E r Y AE =C +I (r1)+G1 AE =C +I (r1)+G2 r1 AE =Y IS1 The horizontal distance of the IS shift equals IS2 …so the IS curve shifts to the right. 1 1 MPC Y G Y

17-9 490 砂 14.2 The LM curve The LM curve is a graph of all combinations of rand y that equate the supply and demand for real money balances. The equation for the LM curve is: M/P=L(r Y) M kY-hr h P h Economics ECONOMICS MANAGEMENT SCHOOL,TONGJI UNIVERSITY
Economics ECONOMICS & MANAGEMENT SCHOOL, TONGJI UNIVERSITY 17-9 14.2 The LM curve M P LrY (, ) The LM curve is a graph of all combinations of r and Y that equate the supply and demand for real money balances. The equation for the LM curve is: Yhk PMh1 r kY hr P M = + = - -

0 Equilibrium in financial markets implies that an increase in income leads to an increase in Deriving the LM curve the interest rate.The LMcurve is upward-sloping (a)The market for real money balances (b)The LM curve LM L(r,Y2) 《 L(r Y) 答 M/P Economics ECONOMICS MANAGEMENT SCHOOL,TONGJI UNIVERSITY
Economics ECONOMICS & MANAGEMENT SCHOOL, TONGJI UNIVERSITY 17-10 Deriving the LM curve M/P r M1 P L (r ,Y1) r1 r2 r Y Y1 r1 L (r ,Y2) r2 Y2 LM (a) The market for real money balances (b) The LM curve Equilibrium in financial markets implies that an increase in income leads to an increase in the interest rate. The LM curve is upward-sloping
按次数下载不扣除下载券;
注册用户24小时内重复下载只扣除一次;
顺序:VIP每日次数-->可用次数-->下载券;
- 同济大学:《经济学》课程教学资源(教案讲义)Ch13 Money Market Equilibrium.pdf
- 同济大学:《经济学》课程教学资源(教案讲义)Ch12-2 The Determination of Equilibrium Output.pdf
- 同济大学:《经济学》课程教学资源(教案讲义)Ch12-1 Consumption and Investment.pdf
- 同济大学:《经济学》课程教学资源(教案讲义)Ch11 National Income Accounting.pdf
- 同济大学:《经济学》课程教学资源(教案讲义)Ch09 Externalities and Public Goods.pdf
- 同济大学:《经济学》课程教学资源(教案讲义)Ch10 Overview of Macroeconomics.pdf
- 同济大学:《经济学》课程教学资源(教案讲义)Ch08 Market For Factors of Production.pdf
- 同济大学:《经济学》课程教学资源(教案讲义)Ch07 General Equilibrium and Economic Efficiency.pdf
- 同济大学:《经济学》课程教学资源(教案讲义)Ch06-2 Imperfect Competition.pdf
- 同济大学:《经济学》课程教学资源(教案讲义)Ch06-1 Analysis of Perfectly Competitive Markets.pdf
- 同济大学:《经济学》课程教学资源(教案讲义)Ch05 Analysis of Cost.pdf
- 同济大学:《经济学》课程教学资源(教案讲义)Ch04 Producer Behavior.pdf
- 同济大学:《经济学》课程教学资源(教案讲义)Ch03 Demand and Consumer Behavior.pdf
- 同济大学:《经济学》课程教学资源(教案讲义)Ch02-2 Applications of Supply and Demand.pdf
- 同济大学:《经济学》课程教学资源(教案讲义)Ch02-1 Supply and Demand.pdf
- 同济大学:《经济学》课程教学资源(教案讲义)Ch01 The Fundamentals of Economics(负责人:李永).pdf
- 同济大学:《经济学》课程教学资源(试卷习题)期终考试试卷(B卷)答案.pdf
- 同济大学:《经济学》课程教学资源(试卷习题)期终考试试卷(B卷)试题.pdf
- 同济大学:《经济学》课程教学资源(试卷习题)期终考试试卷(A卷)答案.pdf
- 同济大学:《经济学》课程教学资源(试卷习题)期终考试试卷(A卷)试题.pdf
- 同济大学:《经济学》课程教学资源(教案讲义)Ch15 Aggregate Demand And Supply.pdf
- 同济大学:《经济学》课程教学资源(教案讲义)Ch16 Economic Growth.pdf
- 吉林大学:《中央银行业务管理》课程教学资源(PPT课件)第一章 中央银行制度的形成和发展.ppt
- 吉林大学:《中央银行业务管理》课程教学资源(PPT课件)第七章 中央银行的其他业务.ppt
- 吉林大学:《中央银行业务管理》课程教学资源(PPT课件)第三章 中央银行业务活动的法规原则与资产负债表.ppt
- 吉林大学:《中央银行业务管理》课程教学资源(PPT课件)第九章 中央银行货币政策的目标与工具.ppt
- 吉林大学:《中央银行业务管理》课程教学资源(PPT课件)第二章 中央银行在现代经济体系中的地位与作用.ppt
- 吉林大学:《中央银行业务管理》课程教学资源(PPT课件)第五章 中央银行的资产业务.ppt
- 吉林大学:《中央银行业务管理》课程教学资源(PPT课件)第八章 中央银行货币政策概述.ppt
- 吉林大学:《中央银行业务管理》课程教学资源(PPT课件)第六章 中央银行的支付清算业务.ppt
- 吉林大学:《中央银行业务管理》课程教学资源(PPT课件)第十一章 中央银行的金融监管.ppt
- 吉林大学:《中央银行业务管理》课程教学资源(PPT课件)第十二章 中央银行与外汇管理.ppt
- 吉林大学:《中央银行业务管理》课程教学资源(PPT课件)第十章 货币政策的作用机制.ppt
- 吉林大学:《中央银行业务管理》课程教学资源(PPT课件)第四章 中央银行的负债业务.ppt
- 吉林大学:《中央银行业务管理》课程教学资源(PPT课件)中央银行学课程总结与辅导(共十二章,负责人:齐艺莹).ppt
- 吉林大学:《宏观经济学》课程j电子教案(PPT课件)第一章 宏观经济学导论(负责人:赵静杰).ppt
- 吉林大学:《宏观经济学》课程j电子教案(PPT课件)古典宏观经济模型.ppt
- 吉林大学:《宏观经济学》课程j电子教案(PPT课件)第二章 国民收入核算.ppt
- 吉林大学:《宏观经济学》课程j电子教案(PPT课件)第五章 通货膨胀理论.ppt
- 吉林大学:《宏观经济学》课程j电子教案(PPT课件)宏观总复习.ppt
