中南财经政法大学:《金融计量学》课程教学课件(双语讲稿)Chapter 07 Difference-in-difference Model 1

Financial Econometrics Chapter 7.Difference-in-difference Model 1 Jin Ling School of Finance,Zhongnan University of Economics and Law
Financial Econometrics Chapter 7. Difference-in-difference Model 1 Jin Ling School of Finance, Zhongnan University of Economics and Law 1

Outline The Difference-in-difference (DID)Model The Condition for DID Model The Steps to estimate DID Model 2
• The Difference-in-difference (DID) Model • The Condition for DID Model • The Steps to estimate DID Model 2 Outline

The DID Model The methodology for causal inference: Experiment Design:Empirical study is based on observed data. ·Natural experiment:个体接受的干预来自其面临环境的变化,使得干预就像随机可控实验中 那样具有随机性。 Natural experiment does not equal randomized experiment:Unconfoundedness. The assignment mechanism in natural experiment:Potential outcomes will not response to treatment before the treatment period;Observation is not selected. Natural experiment(Randomized)and quasi-natural experiment (Not strictly randomized) 3
• The methodology for causal inference: • Experiment Design: Empirical study is based on observed data. • Natural experiment: 个体接受的干预来自其面临环境的变化,使得干预就像随机可控实验中 那样具有随机性。 • Natural experiment does not equal randomized experiment: Unconfoundedness. • The assignment mechanism in natural experiment: Potential outcomes will not response to treatment before the treatment period; Observation is not selected. • Natural experiment (Randomized) and quasi-natural experiment (Not strictly randomized). 3 The DID Model

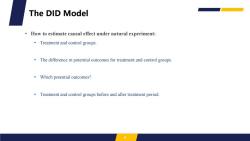
The DID Model How to estimate causal effect under natural experiment: Treatment and control groups. The difference in potential outcomes for treatment and control groups. Which potential outcomes? Treatment and control groups before and after treatment period
• How to estimate causal effect under natural experiment: • Treatment and control groups. • The difference in potential outcomes for treatment and control groups. • Which potential outcomes? • Treatment and control groups before and after treatment period. 4 The DID Model

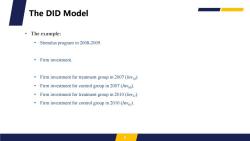
The DID Model ·The example: Stimulus program in 2008-2009 ·Firm investment. Firm investment for treatment group in 2007(/m). Firm investment for control group in 2007 (Invoo). Firm investment for treatment group in 2010(/m). Firm investment for control group in 2010(Invo). 5
• The example: • Stimulus program in 2008-2009. • Firm investment. • Firm investment for treatment group in 2007 (Inv10). • Firm investment for control group in 2007 (Inv00). • Firm investment for treatment group in 2010 (Inv11). • Firm investment for control group in 2010 (Inv01). 5 The DID Model

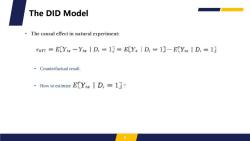
The DID Model The causal effect in natural experiment: TATT E[YiYox I D:=1]=E[Y D:=1]-E[Yor D:=1] Counterfactual result. How to estimate E[Yoz I Di=1]? 6
• The causal effect in natural experiment: • Counterfactual result. • How to estimate ? 6 The DID Model

The DID Model The model specification: 因果效应 VD】 yDel Yoo T=0 T-1 7
• The model specification: 7 The DID Model

The DID Model The model specification Yi=a+BD;+8T+r(DiX T) E[Y。|D:,T]=a十D,+T+r(DXT) EYg{D:=0,T=0]=a E[Ym1D,=0,T=1]=a+8 E[Ya|D,=1,T=0]=a+3 E[Y.ID:=1,T=1]=a+B+8+t
• The model specification : 8 The DID Model

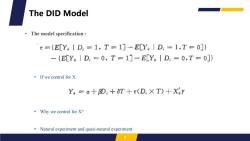
The DID Model The model specification x={E[Y。ID=1,T=1]-E[YgID,=1,T=0]} -{E[Y。1D:=0,T=1]-E[Y。|D=0,T=0]} ·If we control for X Ya=a+8D;+8T+r(D:X T)+X3Y ·Why we control for X? Natural experiment and quasi-natural experiment. 9
• The model specification : • If we control for X: • Why we control for X? • Natural experiment and quasi-natural experiment. 9 The DID Model

The DID Model The prevalence of DID model: Currie et al.(2020):Technology and Big Data Are Changing Economics:Mining Text to Track Methods Panel A.Difference-in-differences Panel B.Regression discontinuity 20.25 201 02 音5 0.1 50.05 0 0 19801985199018952000200520102015 19801905198019952000200520102015 Panel C.Event study Panel D.Bunching 0.06 0.0 0.02 0.02 0 19801965199019952000200520102015 1990198519901952000200520102015 NBER working papers Top-tive joumals FIGURE 4.QUASI-EXPERIMENTAL METHODS 10
• The prevalence of DID model: • Currie et al. (2020): Technology and Big Data Are Changing Economics: Mining Text to Track Methods. 10 The DID Model
按次数下载不扣除下载券;
注册用户24小时内重复下载只扣除一次;
顺序:VIP每日次数-->可用次数-->下载券;
- 中南财经政法大学:《金融计量学》课程教学课件(双语讲稿)Chapter 06 Control Variable and Fixed Effect.pdf
- 中南财经政法大学:《金融计量学》课程教学课件(双语讲稿)Chapter 05 Mediation Effect and Moderating Effect.pdf
- 中南财经政法大学:《金融计量学》课程教学课件(双语讲稿)Chapter 04 Causal Inference framework 2.pdf
- 中南财经政法大学:《金融计量学》课程教学课件(双语讲稿)Chapter 03 Causal Inference framework 1.pdf
- 中南财经政法大学:《金融计量学》课程教学课件(双语讲稿)Chapter 02 Statistical Foundations Overview of OLS.pdf
- 中南财经政法大学:《金融计量学》课程教学课件(双语讲稿)Chapter 14 Application Financial Market.pdf
- 中南财经政法大学:《金融计量学》课程教学课件(双语讲稿)Chapter 13 Application Corporate Finance.pdf
- 中南财经政法大学:《金融计量学》课程教学课件(双语讲稿)Chapter 12 Application Policy Evaluation.pdf
- 中南财经政法大学:《金融计量学》课程教学课件(双语讲稿)Chapter 11 Regression Discontinuity Design.pdf
- 中南财经政法大学:《金融计量学》课程教学课件(双语讲稿)Chapter 10 Propensity Score Matching.pdf
- 中南财经政法大学:《金融计量学》课程教学课件(双语讲稿)Chapter 01 Introduction to Financial Econometrics.pdf
- 中南财经政法大学:《中级计量经济学》课程教学课件(PPT讲稿)week 13 限值因变量模型和样本选择纠正.pptx
- 中南财经政法大学:《中级计量经济学》课程教学课件(PPT讲稿)week 11 高深的面板数据.pptx
- 中南财经政法大学:《中级计量经济学》课程教学课件(PPT讲稿)week 10 独立混合横截面数据.pptx
- 《中级计量经济学》课程教学资源(书籍文献)James H. Stock, Mark W. Watson - Introduction to Econometrics, Global Edition-Pearson Education Limited(2020).pdf
- 《中级计量经济学》课程教学资源(书籍文献)工具变量IV - IV paper-Acemoglu-ColonialOriginsComparative-2001.pdf
- 中南财经政法大学:《中级计量经济学》课程教学课件(PPT讲稿)week 9 工具变量估计与两阶段最小二乘法.pptx
- 中南财经政法大学:《中级计量经济学》课程教学课件(PPT讲稿)week 8 模型设定误差和数据问题.pptx
- 中南财经政法大学:《中级计量经济学》课程教学课件(PPT讲稿)week 6 异方差性(主讲:刘玲).pptx
- 中南财经政法大学:《中级计量经济学》课程教学课件(PPT讲稿)week 5 多元回归分析-深入专题.pptx
- 中南财经政法大学:《金融计量学》课程教学课件(双语讲稿)Chapter 08 Difference-in-difference Model 2.pdf
- 中南财经政法大学:《金融计量学》课程教学课件(双语讲稿)Chapter 09 Instrumental Variable Regression.pdf
- 《马克思主义政治经济学》课程教学课件(PPT讲稿)第一章 导论.ppt
- 《马克思主义政治经济学》课程教学课件(PPT讲稿)第七章 经济全球化与当代资本主义.ppt
- 《马克思主义政治经济学》课程教学课件(PPT讲稿)第三章 剩余价值理论.ppt
- 《马克思主义政治经济学》课程教学课件(PPT讲稿)第二章 马克思与劳动价值论.ppt
- 《马克思主义政治经济学》课程教学课件(PPT讲稿)第五章 资本社会化与资本主义所有制.ppt
- 《马克思主义政治经济学》课程教学课件(PPT讲稿)第八章 资本主义的未来.ppt
- 《马克思主义政治经济学》课程教学课件(PPT讲稿)第六讲 资本主义市场经济体制与资本主义经济的发展.ppt
- 《马克思主义政治经济学》课程教学课件(PPT讲稿)第四章 本积累和资本主义分配制度.ppt
- 重庆工商大学:《会计学》教学大纲 ACCOUNTING A.pdf
- 重庆工商大学:《会计学》课程授课教案(讲义).pdf
- 重庆工商大学:《会计学》课程教学实验指导书.doc
- 重庆工商大学:《会计学》课程教学课件(PPT讲稿)第一章 总论.ppt
- 重庆工商大学:《会计学》课程教学课件(PPT讲稿)第三章 主要经济业务的核算.ppt
- 重庆工商大学:《会计学》课程教学课件(PPT讲稿)第二章 复式记账法.pptx
- 重庆工商大学:《会计学》课程教学课件(PPT讲稿)第五章 信息化背景下的会计核算.pptx
- 重庆工商大学:《会计学》课程教学课件(PPT讲稿)第六章 会计信息的应用与决策支持.ppt
- 重庆工商大学:《会计学》课程教学课件(PPT讲稿)第四章 财务会计报告的编制与分析.ppt
- 重庆工商大学:《贸易经济学》课程教学大纲 Economics of Trade.doc
