《实用非参数统计》课程教学资源(阅读材料)Patrick Breheny's Spline and penalized regression note
Introduction Regression splines (parametric Smoothing splines (nonparametric Splines and penalized regression Patrick Breheny November 23 Patrick Breheny STA 621:Nonparametric Statistics
Introduction Regression splines (parametric) Smoothing splines (nonparametric) Splines and penalized regression Patrick Breheny November 23 Patrick Breheny STA 621: Nonparametric Statistics
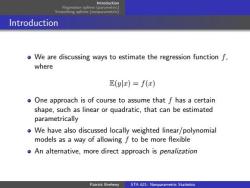
Introduction Regression splines (parametric Smoothing splines (nonparametric) Introduction o We are discussing ways to estimate the regression function f. where E(yx)=f(x) o One approach is of course to assume that f has a certain shape,such as linear or quadratic,that can be estimated parametrically o We have also discussed locally weighted linear/polynomial models as a way of allowing f to be more flexible o An alternative,more direct approach is penalization Patrick Breheny STA 621:Nonparametric Statistics
Introduction Regression splines (parametric) Smoothing splines (nonparametric) Introduction We are discussing ways to estimate the regression function f, where E(y|x) = f(x) One approach is of course to assume that f has a certain shape, such as linear or quadratic, that can be estimated parametrically We have also discussed locally weighted linear/polynomial models as a way of allowing f to be more flexible An alternative, more direct approach is penalization Patrick Breheny STA 621: Nonparametric Statistics
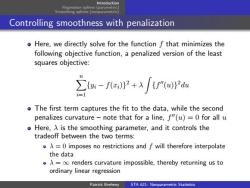
Introduction Regression splines (parametric Smoothing splines (nonparametric Controlling smoothness with penalization o Here,we directly solve for the function f that minimizes the following objective function,a penalized version of the least squares objective: ∑-feP+Af"o2a o The first term captures the fit to the data,while the second penalizes curvature-note that for a line,f"(u)=0 for all u o Here,A is the smoothing parameter,and it controls the tradeoff between the two terms: =0 imposes no restrictions and f will therefore interpolate the data A=oo renders curvature impossible,thereby returning us to ordinary linear regression Patrick Breheny STA 621:Nonparametric Statistics
Introduction Regression splines (parametric) Smoothing splines (nonparametric) Controlling smoothness with penalization Here, we directly solve for the function f that minimizes the following objective function, a penalized version of the least squares objective: Xn i=1 {yi − f(xi)} 2 + λ Z {f 00(u)} 2 du The first term captures the fit to the data, while the second penalizes curvature – note that for a line, f 00(u) = 0 for all u Here, λ is the smoothing parameter, and it controls the tradeoff between the two terms: λ = 0 imposes no restrictions and f will therefore interpolate the data λ = ∞ renders curvature impossible, thereby returning us to ordinary linear regression Patrick Breheny STA 621: Nonparametric Statistics
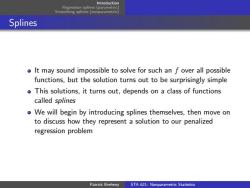
Introduction Regression splines (parametric Smoothing splines (nonparametric Splines It may sound impossible to solve for such an f over all possible functions,but the solution turns out to be surprisingly simple This solutions,it turns out,depends on a class of functions called splines o We will begin by introducing splines themselves,then move on to discuss how they represent a solution to our penalized regression problem Patrick Breheny STA 621:Nonparametric Statistics
Introduction Regression splines (parametric) Smoothing splines (nonparametric) Splines It may sound impossible to solve for such an f over all possible functions, but the solution turns out to be surprisingly simple This solutions, it turns out, depends on a class of functions called splines We will begin by introducing splines themselves, then move on to discuss how they represent a solution to our penalized regression problem Patrick Breheny STA 621: Nonparametric Statistics
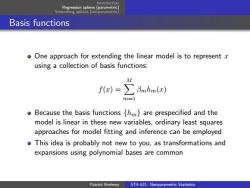
Regression splines (parametric Smoothing splines (nonparametric) Basis functions One approach for extending the linear model is to represent z using a collection of basis functions: M fe)=∑Bmtim(d) m=1 Because the basis functions [hm}are prespecified and the model is linear in these new variables,ordinary least squares approaches for model fitting and inference can be employed o This idea is probably not new to you,as transformations and expansions using polynomial bases are common Patrick Breheny STA 621:Nonparametric Statistics
Introduction Regression splines (parametric) Smoothing splines (nonparametric) Basis functions One approach for extending the linear model is to represent x using a collection of basis functions: f(x) = X M m=1 βmhm(x) Because the basis functions {hm} are prespecified and the model is linear in these new variables, ordinary least squares approaches for model fitting and inference can be employed This idea is probably not new to you, as transformations and expansions using polynomial bases are common Patrick Breheny STA 621: Nonparametric Statistics
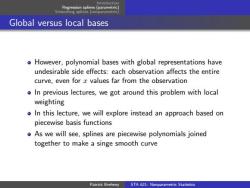
Regression splines (parametric Smoothing splines (nonparametric Global versus local bases o However,polynomial bases with global representations have undesirable side effects:each observation affects the entire curve,even for c values far from the observation o In previous lectures,we got around this problem with local weighting o In this lecture,we will explore instead an approach based on piecewise basis functions o As we will see,splines are piecewise polynomials joined together to make a singe smooth curve Patrick Breheny STA 621:Nonparametric Statistics
Introduction Regression splines (parametric) Smoothing splines (nonparametric) Global versus local bases However, polynomial bases with global representations have undesirable side effects: each observation affects the entire curve, even for x values far from the observation In previous lectures, we got around this problem with local weighting In this lecture, we will explore instead an approach based on piecewise basis functions As we will see, splines are piecewise polynomials joined together to make a singe smooth curve Patrick Breheny STA 621: Nonparametric Statistics
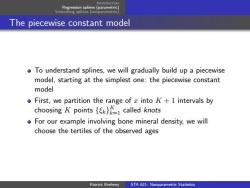
Regression splines(parametric) Smoothing splines (nonparametric The piecewise constant model o To understand splines,we will gradually build up a piecewise model,starting at the simplest one:the piecewise constant model o First,we partition the range of z into K+1 intervals by choosing K points called knots o For our example involving bone mineral density,we will choose the tertiles of the observed ages Patrick Breheny STA 621:Nonparametric Statistics
Introduction Regression splines (parametric) Smoothing splines (nonparametric) The piecewise constant model To understand splines, we will gradually build up a piecewise model, starting at the simplest one: the piecewise constant model First, we partition the range of x into K + 1 intervals by choosing K points {ξk} K k=1 called knots For our example involving bone mineral density, we will choose the tertiles of the observed ages Patrick Breheny STA 621: Nonparametric Statistics
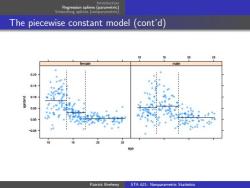
Regression splines (parametric Smoothing splines (nonparametric The piecewise constant model (cont'd) 25 male 020 0.00 -005 20 的 Patrick Breheny STA 621:Nonparametric Statistics
Introduction Regression splines (parametric) Smoothing splines (nonparametric) The piecewise constant model (cont’d) age spnbmd −0.05 0.00 0.05 0.10 0.15 0.20 10 15 20 25 female 10 15 20 25 male Patrick Breheny STA 621: Nonparametric Statistics
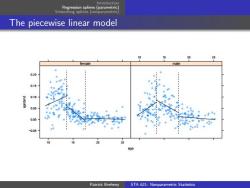
Regression splines (parametric) Smoothing splines (nonparametric The piecewise linear model 20 25 male 020 015 0.00 -005 20 Patrick Breheny STA 621:Nonparametric Statistics
Introduction Regression splines (parametric) Smoothing splines (nonparametric) The piecewise linear model age spnbmd −0.05 0.00 0.05 0.10 0.15 0.20 10 15 20 25 female 10 15 20 25 male Patrick Breheny STA 621: Nonparametric Statistics
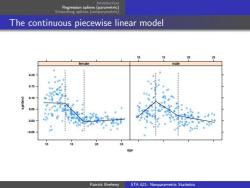
Regression splines (parametric Smoothing splines (nonparametric The continuous piecewise linear model 25 male 0.20 0.15 0 .05 C.00 -0.05 20 25 age Patrick Breheny STA 621:Nonparametric Statistics
Introduction Regression splines (parametric) Smoothing splines (nonparametric) The continuous piecewise linear model age spnbmd −0.05 0.00 0.05 0.10 0.15 0.20 10 15 20 25 female 10 15 20 25 male Patrick Breheny STA 621: Nonparametric Statistics
按次数下载不扣除下载券;
注册用户24小时内重复下载只扣除一次;
顺序:VIP每日次数-->可用次数-->下载券;
- 《实用非参数统计》课程教学资源(阅读材料)W.J.Braun's Nonparametric regression notes.pdf
- 《实用非参数统计》课程教学资源(阅读材料)Density Estimation.pdf
- 《实用非参数统计》课程教学资源(阅读材料)Permutation test.pdf
- 《实用非参数统计》课程教学资源(阅读材料)一些理论 Bootstrap and Jackknife Estimation of Sampling Distributions.pdf
- 《实用非参数统计》课程教学资源(阅读材料)Bootstrap and Jackknife.pdf
- 《实用非参数统计》课程教学资源(阅读材料)A Review on Empirical Likelihood Methods for Regression.pdf
- 《实用非参数统计》课程教学资源(阅读材料)Empirical Likelihood notes.pdf
- 《实用非参数统计》课程教学资源(阅读材料)Statistical functionals and delta method.pdf
- 《实用非参数统计》课程教学资源(阅读材料)Asymtotic relative efficiency of two tests.pdf
- 《实用非参数统计》课程教学资源(阅读材料)回归与方差分析 Practical Regression and Anova using R(共16章)Faraway-PRA.pdf
- 《实用非参数统计》课程教学资源(阅读材料)A Comparative Study of Tests for Homogeneity of Variances, with Applications to the Outer Continental Shelf Bidding Data.pdf
- 《实用非参数统计》课程教学资源(阅读材料)Chi square test with both margins fixed.pdf
- 《实用非参数统计》课程教学资源(阅读材料)Conditonal versus unconditional exact tests for comparing two binomials.pdf
- 《实用非参数统计》课程教学资源(阅读材料)Fisher's Exact Test , When to use Fisher's exact test.pdf
- 《实用非参数统计》课程教学资源(阅读材料)Association Between Variables.pdf
- 《实用非参数统计》课程教学资源(阅读材料)with Implementation in S-PLUS.pdf
- 《实用非参数统计》课程教学资源(阅读材料)Binomial Distribution - Hypothesis Testing, Confidence Intervals(CI), and Reliability.pdf
- 《实用非参数统计》课程教学资源(阅读材料)Introduction Review of R.pdf
- 中国科学技术大学:《实用非参数统计》课程教学资源(课件讲义)第一讲 参数统计与非参数统计——回顾与简介.pdf
- 《多元统计分析》课程教学资源(阅读材料)Matrix Cook Book.pdf
- 中国科学技术大学:《概率论与数理统计》课程教学资源(课件讲义)简介:Why Probability and Statistics - some examples.ppt
- 中国科学技术大学:《概率论与数理统计》课程教学资源(课件讲义)第一章 事件与概率 1.1 事件及其运算、概率及其性质.pdf
- 中国科学技术大学:《概率论与数理统计》课程教学资源(课件讲义)第一章 事件与概率 1.2 古典概型和几何概率.pdf
- 中国科学技术大学:《概率论与数理统计》课程教学资源(课件讲义)第一章 事件与概率 1.3 条件概率与独立性.pdf
- 中国科学技术大学:《概率论与数理统计》课程教学资源(课件讲义)第一章 随机事件与概率(主讲:张伟平)样本空间与概率.pdf
- 中国科学技术大学:《概率论与数理统计》课程教学资源(课件讲义)第二章 随机变量及其分布.pdf
- 中国科学技术大学:《概率论与数理统计》课程教学资源(课件讲义)第二章 随机变量及其分布 2.1 离散型随机变量.pdf
- 中国科学技术大学:《概率论与数理统计》课程教学资源(课件讲义)第二章 随机变量及其分布 2.2 连续型随机变量.pdf
- 中国科学技术大学:《概率论与数理统计》课程教学资源(课件讲义)第二章 随机变量及其分布 2.3 多维随机变量.pdf
- 中国科学技术大学:《概率论与数理统计》课程教学资源(课件讲义)第二章 随机变量及其分布 2.4 条件分布与独立性.pdf
- 中国科学技术大学:《概率论与数理统计》课程教学资源(课件讲义)第二章 随机变量及其分布 2.5 随机变量的函数的分布.pdf
- 中国科学技术大学:《概率论与数理统计》课程教学资源(课件讲义)第三章 随机变量的数字特征.pdf
- 中国科学技术大学:《概率论与数理统计》课程教学资源(课件讲义)第三章 随机变量的数字特征 3.1 中心位置数字特征.pdf
- 中国科学技术大学:《概率论与数理统计》课程教学资源(课件讲义)第三章 随机变量的数字特征 3.2 方差、相关系数以及其他数字特征.pdf
- 中国科学技术大学:《概率论与数理统计》课程教学资源(课件讲义)第四章 大数律与中心极限定理.pdf
- 中国科学技术大学:《概率论与数理统计》课程教学资源(课件讲义)第四章 大数律与中心极限定理 4.1 大数律与中心极限定理.pdf
- 中国科学技术大学:《概率论与数理统计》课程教学资源(课件讲义)第五章 数理统计的基本概念与抽样分布.pdf
- 中国科学技术大学:《概率论与数理统计》课程教学资源(课件讲义)第五章 数理统计的基本概念与抽样分布 5.1 数理统计的基本概念.pdf
- 中国科学技术大学:《概率论与数理统计》课程教学资源(课件讲义)第五章 数理统计的基本概念与抽样分布 5.2 抽样分布.pdf
- 中国科学技术大学:《概率论与数理统计》课程教学资源(课件讲义)第六章 参数估计.pdf
