《新编大学英语》综合教程(第三版第四册)B4U5_self-market_self-writing_图表作文常用开头句

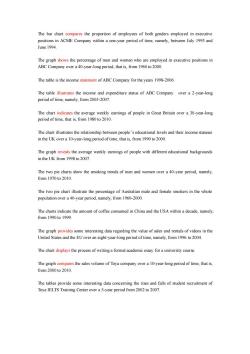
The bar chart compares the proportion of employees of both genders employed in executive positions in ACME Company within a one-year period of time,namely,between July 1993 and June 1994. The graph shows the percentage of men and women who are employed in executive positions in ABC Company over a 40-year-long period,that is,from 1960 to 2000. The table is the income statement of ABC Company for the years 1998-2006. The table illustrates the income and expenditure status of ABC Company over a 2-year-long period of time,namely,from 2005-2007. The chart indicates the average weekly earnings of people in Great Britain over a 30-year-long period of time,that is,from 1980 to 2010. The chart illustrates the relationship between people's educational levels and their income statuses in the UK over a 10-year-long period of time,that is,from 1990 to 2000. The graph reveals the average weekly earnings of people with different educational backgrounds in the UK from 1998 to 2007. The two pie charts show the smoking trends of men and women over a 40-year period,namely, from1970to2010. The two pie chart illustrate the percentage of Australian male and female smokers in the whole population over a 40-year period,namely,from 1960-2000. The charts indicate the amount of coffee consumed in China and the USA within a decade,namely, from1990to1999. The graph provides some interesting data regarding the value of sales and rentals of videos in the United States and the EU over an eight-year-long period of time,namely,from 1996 to 2004. The chart displays the process of writing a formal academic essay for a university course. The graph compares the sales volume of Toya company over a 10-year-long period of time,that is, from2000to2010. The tables provide some interesting data concerning the rises and falls of student recruitment of Toya IELTS Training Center over a 5-year period from 2002 to 2007
The bar chart compares the proportion of employees of both genders employed in executive positions in ACME Company within a one-year period of time, namely, between July 1993 and June 1994. The graph shows the percentage of men and women who are employed in executive positions in ABC Company over a 40-year-long period, that is, from 1960 to 2000. The table is the income statement of ABC Company for the years 1998-2006. The table illustrates the income and expenditure status of ABC Company over a 2-year-long period of time, namely, from 2005-2007. The chart indicates the average weekly earnings of people in Great Britain over a 30-year-long period of time, that is, from 1980 to 2010. The chart illustrates the relationship between people’s educational levels and their income statuses in the UK over a 10-year-long period of time, that is, from 1990 to 2000. The graph reveals the average weekly earnings of people with different educational backgrounds in the UK from 1998 to 2007. The two pie charts show the smoking trends of men and women over a 40-year period, namely, from 1970 to 2010. The two pie chart illustrate the percentage of Australian male and female smokers in the whole population over a 40-year period, namely, from 1960-2000. The charts indicate the amount of coffee consumed in China and the USA within a decade, namely, from 1990 to 1999. The graph provides some interesting data regarding the value of sales and rentals of videos in the United States and the EU over an eight-year-long period of time, namely, from 1996 to 2004. The chart displays the process of writing a formal academic essay for a university course. The graph compares the sales volume of Toya company over a 10-year-long period of time, that is, from 2000 to 2010. The tables provide some interesting data concerning the rises and falls of student recruitment of Toya IELTS Training Center over a 5-year period from 2002 to 2007
按次数下载不扣除下载券;
注册用户24小时内重复下载只扣除一次;
顺序:VIP每日次数-->可用次数-->下载券;
- 《新编大学英语》综合教程(第三版第四册)B4U5_self-market_self-watching_rich list.doc
- 《新编大学英语》综合教程(第三版第四册)B4U5_self-market_self-reading_true role models.doc
- 《新编大学英语》综合教程(第三版第四册)B4U5_self-market_self-listening_2000sydney.doc
- 《新编大学英语》综合教程(第三版第四册)B4U5_self-market_quiz_Quiz.ppt
- 《新编大学英语》综合教程(第三版第四册)B4U5_self-market_B4U05 quiz.doc
- 《新编大学英语》综合教程(第三版第四册)B4U5_background information.doc
- 《新编大学英语》综合教程(第三版第四册)B4U5 Translation & Writing.ppt
- 《新编大学英语》综合教程(第三版第四册)B4U5 Read by critical thinking.ppt
- 《新编大学英语》综合教程(第三版第四册)B4U5 Menu.ppt
- 《新编大学英语》综合教程(第三版第四册)B4U5 Activate.ppt
- 《新编大学英语》综合教程(第三版第四册)B4U4_self-market_vocabulary and structure.doc
- 《新编大学英语》综合教程(第三版第四册)B4U4_self-market_self-writing_如何写分论点(2).doc
- 《新编大学英语》综合教程(第三版第四册)B4U4_self-market_self-reading_Unleashing the power of creativity.doc
- 《新编大学英语》综合教程(第三版第四册)B4U4_self-market_self-reading_Enhancing Creativity in your children by blogging.doc
- 《新编大学英语》综合教程(第三版第四册)B4U4_self-market_self-reading_16 habits of highly creative people.doc
- 《新编大学英语》综合教程(第三版第四册)B4U4_self-market_self-listening_never too young.doc
- 《新编大学英语》综合教程(第三版第四册)B4U4_self-market_background information.doc
- 《新编大学英语》综合教程(第三版第四册)B4U4_self-market_06B404 QUIZ_Unit Four QUIZ.doc
- 《新编大学英语》综合教程(第三版第四册)B4U4_self-market_06B404 QUIZ_sentence unit4.ppt
- 《新编大学英语》综合教程(第三版第四册)B4U4_sample.doc
- 《新编大学英语》综合教程(第三版第四册)B4U5_Vocabulary and grammar.doc
- 《新编大学英语》综合教程(第三版第四册)B4U6 Activate.ppt
- 《新编大学英语》综合教程(第三版第四册)B4U6 Menu.ppt
- 《新编大学英语》综合教程(第三版第四册)B4U6 Read by critical thinking.ppt
- 《新编大学英语》综合教程(第三版第四册)B4U6 Translation & Writing.ppt
- 《新编大学英语》综合教程(第三版第四册)B4U6_Background information.doc
- 《新编大学英语》综合教程(第三版第四册)B4U6_self-market_oral quiz.ppt
- 《新编大学英语》综合教程(第三版第四册)B4U6_self-market_quiz_B4U06 Quiz.doc
- 《新编大学英语》综合教程(第三版第四册)B4U6_self-market_self-listening_a pilot's job.doc
- 《新编大学英语》综合教程(第三版第四册)B4U6_self-market_self-listening_Words you need to know.doc
- 《新编大学英语》综合教程(第三版第四册)B4U6_self-market_self-reading_Why would people like to take risks.doc
- 《新编大学英语》综合教程(第三版第四册)B4U6_self-market_self-writing_图表作文常用结尾句.doc
- 《新编大学英语》综合教程(第三版第四册)B4U6_Words, phrases and grammarical points.doc
- 《新编大学英语》综合教程(第三版第四册)B4U2_self-market_For Teacher, B4U2.doc
- 《大学英语》课程PPT教学课件(学术英语综合)Unit 01 Economics(Academic English - An Integrated Course for Undergraduates).ppt
- 《大学英语》课程PPT教学课件(学术英语综合)Unit 02 Business Ethics.ppt
- 《大学英语》课程PPT教学课件(学术英语综合)Unit 10 Language Acquisition.ppt
- 《大学英语》课程PPT教学课件(学术英语综合)Unit 03 Psychology.ppt
- 《大学英语》课程PPT教学课件(学术英语综合)Unit 04 Environment.ppt
- 《大学英语》课程PPT教学课件(学术英语综合)Unit 05 Philosophy.ppt
