同济大学:《Matlab在机械设计中的应用》课程电子教案(PPT课件)Chapter 05 Plotting
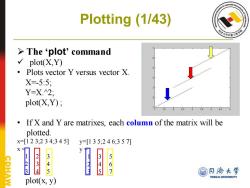
Plotting (1/43) >The‘plot'command √ plot(X,Y) 。 Plots vector Y versus vector X. X=5:5, Y=X.2; plot(X,Y); 25 35 If X and Y are matrixes,each column of the matrix will be plotted. x=[123,234;345] y=[135,246,357刀 345 23 345 56 7 @月济大学 TONGJI UNIVERSITY plot(x,y)
Plotting (1/43) ➢ The ‘plot’ command ✓ plot(X,Y) • Plots vector Y versus vector X. X=-5:5; Y=X.^2; plot(X,Y) ; • If X and Y are matrixes, each column of the matrix will be plotted. x=[1 2 3;2 3 4;3 4 5] x = 1 2 3 2 3 4 3 4 5 plot(x, y) y=[1 3 5;2 4 6;3 5 7] y = 1 3 5 2 4 6 3 5 7

Plotting (2/43) plot(Y) Plots the columns of Y versus their index (Y is a real number) Y=1:10; plot(Y); If Y is complex,plot(Y)is equivalent to plot(real(Y),imag(Y)). Y=[1+i,2+2i,3-2i,4+3i]: plot(Y); @月协大学 TONGJI UNIVERSITY
Plotting (2/43) ✓ plot(Y) • Plots the columns of Y versus their index (Y is a real number) Y=1:10; plot(Y); • If Y is complex, plot(Y) is equivalent to plot(real(Y),imag(Y)). Y=[1+i,2+2i,3-2i,4+3i]; plot(Y);
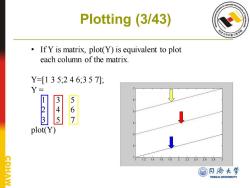
Plotting (3/43) If Y is matrix,plot(Y)is equivalent to plot each column of the matrix Y=[135;246,357] Y- 567 plot(Y) 12 1.4 1618222242628 翻日济大学 TONGJI UNIVERSITY
Plotting (3/43) • If Y is matrix, plot(Y) is equivalent to plot each column of the matrix. Y=[1 3 5;2 4 6;3 5 7]; Y = 1 3 5 2 4 6 3 5 7 plot(Y)

Plotting (4/43) >How to plot a figure like this? title(name of the figure') sin(x)cos(x) legend(namel','name2') 0.9 sin(x) 0.8 cos(x) 0.7 0.6 point of intersection 0.5 4 ylabel(name text(xy,note?) 02 CPHAW 0 0.2 0.4 0.6 0.8 12 1.6 @月停大学 TONGJI UNIVERSITY xlabel(name)
Plotting (4/43) ➢ How to plot a figure like this? title(‘name of the figure’) legend(‘name1’,’name2’) xlabel(‘name’) ylabel(‘name’) text(x,y,‘note’)

Plotting (5/43) linspace(x1,x2)generates a row vector of 100 linearly equally spaced points between x1 and x2 linspace(x1,x2,N)generates N points between x1 and x2 x linspace(10,20,5) X= 10.0012.5015.0017.5020.00 logspace(x1,x2)can be used for logarithmically equally spaced points PHAW 同濟大学 TONGJI UNIVERSITY
Plotting (5/43) ➢ linspace(x1,x2) generates a row vector of 100 linearly equally spaced points between x1 and x2 ➢ linspace(x1,x2,N) generates N points between x1 and x2 x = linspace(10,20,5) x = 10.00 12.50 15.00 17.50 20.00 ➢ logspace(x1,x2) can be used for logarithmically equally spaced points
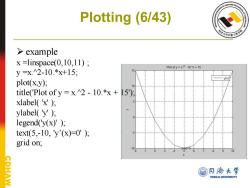
Plotting (6/43) example x =linspace(0,10,11); Plot of y =x2 -10.'x+15 y=x2-10.*x+15; y(x) plot(x,y); title('Plot of y x.2-10.*x+15); xlabel('x') ylabel('y') legend('y(x)'); text(5,-10,y(x)=0'); grid on; CPHAW @月协大学 TONGJI UNIVERSITY
Plotting (6/43) ➢ example x =linspace(0,10,11) ; y =x.^2-10.*x+15; plot(x,y); title('Plot of y = x.^2 - 10.*x + 15'); xlabel( 'x' ); ylabel( 'y' ); legend('y(x)' ); text(5,-10, 'y’(x)=0' ); grid on;
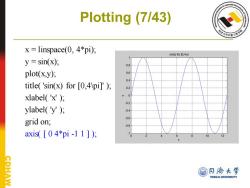
Plotting (7/43) x=linspace(0,4*pi); sin(x)for [0,4 y=sin(x); plot(x,y); 0.6 0.4 title('sin(x)for [0,4 pi]'); 02 xlabel('x') ylabel('y') 0.6 grid on; 0.8 axis([04*pi-11])月 0 12 @日济大学 AW TONGJI UNIVERSITY
Plotting (7/43) x = linspace(0, 4*pi); y = sin(x); plot(x,y); title( 'sin(x) for [0,4\pi]' ); xlabel( 'x' ); ylabel( 'y' ); grid on; axis( [ 0 4*pi -1 1 ] );
Plotting (8/43) axis Control axis scaling and appearance axis[(XMIN XMAX YMIN YMAX)]sets scaling for the x-and y-axes on the current plot. axis equal sets the axis increments to be equal on both axes. axis auto returns the axis scaling to its default. axis off turns off all axis labeling,tick marks and background. axis on turns axis labeling,tick marks and background back on @月诱大学 TONGJI UNIVERSITY
Plotting (8/43) ➢ axis Control axis scaling and appearance. ✓ axis[(XMIN XMAX YMIN YMAX)] sets scaling for the x- and y-axes on the current plot. ✓ axis equal sets the axis increments to be equal on both axes. ✓ axis auto returns the axis scaling to its default. ✓ axis off turns off all axis labeling, tick marks and background. ✓ axis on turns axis labeling, tick marks and background back on
Plotting (9/43) a形 >Multiple Graphs x=0:pi/100:2*pi, y1=sin(2*x); y2=2*cos(2*x); plot(x.y1,x,y2); or x=0:pi/100:2*pi; y1=sin(2*x); y2=2*c0s(2*x); plot(x,y1); PHAW hold on @日济大学 plot(x.y2); TONGJI UNIVERSITY
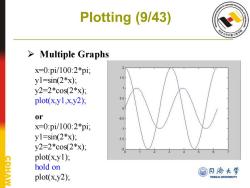
Plotting (9/43) ➢ Multiple Graphs x=0:pi/100:2*pi; y1=sin(2*x); y2=2*cos(2*x); plot(x,y1,x,y2); or x=0:pi/100:2*pi; y1=sin(2*x); y2=2*cos(2*x); plot(x,y1); hold on plot(x,y2);
Plotting (10/43) x=linspace(0,4*pi); yl sin(x); y2=sin(x).^2; y3=y1+y2; plot(x,y1,'b-); hold on; plot(x.y2,'r--); plot(x,y3,'g:); hold off, ↑ 12 14 property of the line CDHAW @月协大学 TONGJI UNIVERSITY
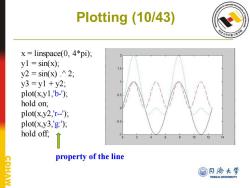
Plotting (10/43) x = linspace(0, 4*pi); y1 = sin(x); y2 = sin(x) .^ 2; y3 = y1 + y2; plot(x,y1,'b-'); hold on; plot(x,y2,'r--'); plot(x,y3,'g:'); hold off; property of the line
按次数下载不扣除下载券;
注册用户24小时内重复下载只扣除一次;
顺序:VIP每日次数-->可用次数-->下载券;
- 同济大学:《Matlab在机械设计中的应用》课程电子教案(PPT课件)Chapter 04 Branches and Loops.ppt
- 同济大学:《Matlab在机械设计中的应用》课程电子教案(PPT课件)Chapter 03Top-down and bottom-up design.ppt
- 同济大学:《Matlab在机械设计中的应用》课程电子教案(PPT课件)Chapter 02 MATLAB Basics(负责人:陈明).ppt
- 同济大学:《Matlab在机械设计中的应用》课程电子教案(PPT课件)Chapter 01 MATLAB Programming for Mechanical Engineering(Introduction to MATLAB).ppt
- 同济大学:《Matlab在机械设计中的应用》课程教学资源(试卷习题)Final Examination(B)The First Semester(2013-2014).pdf
- 同济大学:《Matlab在机械设计中的应用》课程教学资源(试卷习题)Final Examination(A)The First Semester(2013-2014).pdf
- 运城学院:《机械原理》课程教学资源(课件讲稿)第6章 齿轮.pdf
- 运城学院:《机械原理》课程教学资源(课件讲稿)第2章 平面机构的结构分析.pdf
- 运城学院:《机械原理》课程教学资源(课件讲稿)第8章 其他常见机构.pdf
- 运城学院:《机械原理》课程教学资源(课件讲稿)第9章 机械中的摩擦与效率.pdf
- 运城学院:《机械原理》课程教学资源(课件讲稿)第5章 凸轮机构.pdf
- 运城学院:《机械原理》课程教学资源(课件讲稿)第10章 机械的平衡.pdf
- 运城学院:《机械原理》课程教学资源(课件讲稿)第7章 轮系(Gear Train).pdf
- 运城学院:《机械原理》课程教学资源(课件讲稿)第3章 平面机构的运动分析(Kinematic Analysis).pdf
- 运城学院:《机械原理》课程教学资源(课件讲稿)第4章 平面四杆机构.pdf
- 运城学院:《机械原理》课程教学资源(课件讲稿)第1章 绪论(负责人:倪娟).pdf
- 运城学院:《机械原理》课程教学资源(教案讲义)第1章 绪论(打印版).pdf
- 运城学院:《机械原理》课程教学资源(教案讲义)第9章 机械中的摩擦和效率.doc
- 运城学院:《机械原理》课程教学资源(教案讲义)第8章 其他常用机构.doc
- 运城学院:《机械原理》课程教学资源(教案讲义)第11章 机械系统运动方案的设计.doc
- 同济大学:《Matlab在机械设计中的应用》课程电子教案(PPT课件)Chapter 06 User-defined Functions.ppt
- 同济大学:《Matlab在机械设计中的应用》课程电子教案(PPT课件)Chapter 07 Sparse Arrays, Cell Arrays, and Structures.ppt
- 同济大学:《Matlab在机械设计中的应用》课程电子教案(PPT课件)Chapter 08 Advanced Mathematics.ppt
- 同济大学:《Matlab在机械设计中的应用》课程电子教案(PPT课件)Chapter 09 Probability and statistics.ppt
- 同济大学:《Matlab在机械设计中的应用》课程电子教案(PPT课件)Chapter 10 Graphical User Interface.ppt
- 同济大学:《Matlab在机械设计中的应用》课程电子教案(PPT课件)Chapter 11 Simulink.pptx
- 同济大学:《汽车构造》课程电子教案(课件讲稿)第一章 内燃机工作原理及总体构造 The Working Principles and Overall Structure of Internal Combustion Engines.pdf
- 同济大学:《汽车构造》课程电子教案(课件讲稿)第二章 机体组及曲柄连杆机构 Engine Block, Crank and Connecting Rod Mechanism.pdf
- 同济大学:《汽车构造》课程电子教案(课件讲稿)第三章 配气机构 Valve Trains(负责人:李理光).pdf
- 同济大学:《汽车构造》课程电子教案(课件讲稿)第四章 汽油机燃油供给系统 Fuel Supply System For Gasoline Engine.pdf
- 同济大学:《汽车构造》课程电子教案(课件讲稿)第六章 进气、排气及增压系统 Intake, Exhaust and Boost Systems.pdf
- 同济大学:《汽车构造》课程电子教案(课件讲稿)第五章 柴油机燃油供给系统 Fuel Supply System for Diesel Engines.pdf
- 同济大学:《汽车构造》课程电子教案(课件讲稿)第七章 发动机冷却系 Cooling System.pdf
- 同济大学:《汽车构造》课程电子教案(课件讲稿)第九章 起动系统 Starting System.pdf
- 同济大学:《汽车构造》课程电子教案(课件讲稿)第八章 发动机润滑系 Lubrication System for Automotive Engines.pdf
- 同济大学:《汽车构造》课程电子教案(课件讲稿)第十章 发动机点火系统 Engine Ignition System.pdf
- 同济大学:《汽车构造》课程电子教案(课件讲稿)第十二章 发动机有害排放物的控制系统 Control System of Harmful Emissions in Engine Exhaust.pdf
- 同济大学:《汽车构造》课程电子教案(课件讲稿)Automobile structure(Types of modern automobiles).pdf
- 同济大学:《汽车构造》课程电子教案(课件讲稿)Chapter 13 传动系统 Overview of automobile drivetrain.pdf
- 同济大学:《汽车构造》课程电子教案(课件讲稿)Chapter 14 离合器 Clutch.pdf
