上海交通大学:《物理实验》精品课程教学资源(讲义)1 Vibrating String

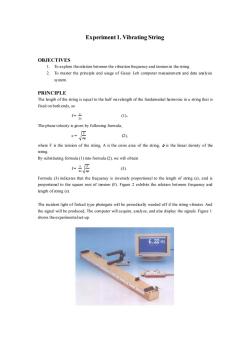
Experiment 1.Vibrating String OBJECTIVES 1.To explore the relation between the vibration frequency and tension in the string. 2.To master the principle and usage of Gassy Leb computer measurement and data analysis system. PRINCIPLE The length of the string is equal to the half wavelength of the fundamental harmonic in a string that is fixed on both ends,so f=C 2s (1), The phase velocity is given by following formula, =限 (2), where F is the tension of the string.A is the cross area of the string.p is the linear density of the string By substituting formula(1)into formula(2),we will obtain =之E 2s Ap (3) Formula(3)indicates that the frequency is inversely proportional to the length of string (s),and is proportional to the square root of tension(F).Figure 2 exhibits the relation between frequency and length ofstring(s). The incident light of forked type photogate will be periodically warded off if the string vibrates.And the signal will be produced,The computer will acquire,analyze,and alse display the signals.Figure 1 shows the experimentalset-up. 6,22s 翻
Experiment 1. Vibrating String OBJECTIVES 1. To explore the relation between the vibration frequency and tension in the string. 2. To master the principle and usage of Gassy Leb computer measurement and data analysis system. PRINCIPLE The length of the string is equal to the half wavelength of the fundamental harmonic in a string that is fixed on both ends, so f = 𝑐 2𝑠 (1), The phase velocity is given by following formula, c = √ 𝐹 𝐴𝛒 (2), where F is the tension of the string, A is the cross area of the string, ρis the linear density of the string. By substituting formula (1) into formula (2), we will obtain f = 1 2𝑠 √ 𝐹 𝐴𝛒 (3). Formula (3) indicates that the frequency is inversely proportional to the length of string (s), and is proportional to the square root of tension (F). Figure 2 exhibits the relation between frequency and length of string (s). The incident light of forked type photogate will be periodically warded off if the string vibrates. And the signal will be produced, The computer will acquire, analyze, and alse display the signals. Figure 1 shows the experimental set-up

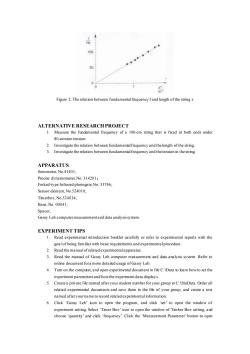
100 50 0 0 m Figure 2.The relation between fundamental frequency fand length ofthe string s ALTERNATIVE RESEARCHPROJECT 1.Measure the fundamental frequency of a 100-cm string that is fixed at both ends under 80-newton tension. 2.Investigate the relation between fundamental frequency and the length of the string 3.Investigate the relation between fundamental frequency and the tension in the string. APPARATUS Sonometer,No.41401; Precise dynamometer,No.314201; Forked-type Infrared photogate,No.33746; Sensor element,No.524010; Timerbox,No.524034: Base,No.00041; Spacer; Gassy Leb computermeasurementand data analysis system EXPERIMENT TIPS 1.Read experimental introduction booklet carefully or refer to experimental reports with the goal of being familiar with basic requirements and experimentalprocedure. 2.Read the manualofrelated experimentalapparatus. 3.Read the manual of Gassy Leb computer measurement and data analysis system.Refer to online document fora more detailed usage of Gassy Leb. 4.Tum on the computer,and open experimental document in file C:\Data to learn how to set the experiment parametersand howthe experiment data displays. 5.Create a private file named after your student number for your group in C:\StuData.Order all related experimental documents and save them in the file of your group,and create a text named afteryour name to record related experimental information. 6.Click 'Gassy Leb'icon to open the program,and click 'set'to open the window of experiment setting.Select Timer Box'icon to open the window of Timber Box setting,and choose 'quantity'and click 'frequency'.Click the Measurement Parameter'button to open
Figure 2. The relation between fundamentalfrequency f and length of the string s ALTERNATIVE RESEARCH PROJECT 1. Measure the fundamental frequency of a 100-cm string that is fixed at both ends under 80-newton tension. 2. Investigate the relation between fundamental frequency and the length of the string. 3. Investigate the relation between fundamental frequency and the tension in the string. APPARATUS Sonometer, No.41401; Precise dynamometer, No. 314201; Forked-type Infrared photogate, No. 33746; Sensor element, No.524010; Timerbox, No.524034; Base, No. 00041; Spacer; Gassy Leb computer measurement and data analysissystem. EXPERIMENT TIPS 1. Read experimental introduction booklet carefully or refer to experimental reports with the goal of being familiar with basic requirements and experimental procedure. 2. Read the manual of related experimental apparatus. 3. Read the manual of Gassy Leb computer measurement and data analysis system. Refer to online document for a more detailed usage of Gassy Leb. 4. Turn on the computer, and open experimental document in file C:\Data to learn how to set the experiment parameters and how the experiment data displays. 5. Create a private file named after your student number for your group in C:\StuData. Order all related experimental documents and save them in the file of your group, and create a text named after your name to record related experimental information. 6. Click ‘Gassy Leb’ icon to open the program, and click ‘set’ to open the window of experiment setting. Select ‘Timer Box’ icon to open the window of Timber Box setting, and choose ‘quantity’ and click ‘frequency’. Click the ‘Measurement Parameter’ button to open

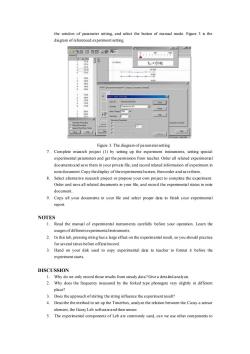
the window of parameter setting,and select the button of manual mode.Figure 3 is the diagram of referenced experiment setting 0色昌⊙8回⊙同 fA=0 Hz 物100 10 1490 CyP¥w厚FF|Dio]cnl Gm 1730 w✉因m用 网可 CTi00nt19%000 Figure 3.The diagram of parameter setting 7.Complete research project (1)by setting up the experiment instruments,setting special experimental parameters and get the permission from teacher.Order all related experimental documentsand save them in your private file,and record related information of experiment in note document.Copy the display of the experimentalscreen,then order and save them. 8.Select alternative research project or propose your own project to complete the experiment. Order and save all related documents in your file,and record the experimental status in note document. 9.Copy all your documents in your file and select proper data to finish your experimental report. NOTES 1.Read the manual of experimental instruments carefully before your operation.Learn the usages ofdifferent experimental instruments. 2.In this lab,pressing string has a large effect on the experimental result,so you should practice for several times before officialrecord. 3.Hand on your disk used to copy experimental data to teacher to format it before the experiment starts. DISCUSSION 1.Why do we only record those results from steady data?Give a detailed analysis. 2.Why does the frequency measured by the forked type photogate vary slightly in different place? 3.Does the approach ofstirring the string influence the experiment result? 4.Describe the method to set up the Timerbox,analyze the relation between the Cassy-s sensor element,the Gassy Leb software and then sensor. 5.The experimental components of Leb are commonly used,can we use other components to
the window of parameter setting, and select the button of manual mode. Figure 3 is the diagram of referenced experiment setting. Figure 3. The diagram of parameter setting 7. Complete research project (1) by setting up the experiment instruments, setting special experimental parameters and get the permission from teacher. Order all related experimental documents and save them in your private file, and record related information of experiment in note document. Copy the display of the experimental screen, then order and save them. 8. Select alternative research project or propose your own project to complete the experiment. Order and save all related documents in your file, and record the experimental status in note document. 9. Copy all your documents in your file and select proper data to finish your experimental report. NOTES 1. Read the manual of experimental instruments carefully before your operation. Learn the usages of different experimental instruments. 2. In this lab, pressing string has a large effect on the experimental result, so you should practice for several times before official record. 3. Hand on your disk used to copy experimental data to teacher to format it before the experiment starts. DISCUSSION 1. Why do we only record those results from steady data? Give a detailed analysis. 2. Why does the frequency measured by the forked type photogate vary slightly in different place? 3. Does the approach of stirring the string influence the experiment result? 4. Describe the method to set up the Timerbox, analyze the relation between the Cassy-s sensor element, the Gassy Leb software and then sensor. 5. The experimental components of Leb are commonly used, can we use other components to

measure the fundamental frequency of string? 6.Illustrate the advantage and disadvantage of the computer measurement and data analysis system. 7.Analyze various problems met in this experiment and make conclusions.Try to do simple estimation in order of magnitude and experimental check if possible,and see if you are right about this
measure the fundamentalfrequency of string? 6. Illustrate the advantage and disadvantage of the computer measurement and data analysis system. 7. Analyze various problems met in this experiment and make conclusions. Try to do simple estimation in order of magnitude and experimental check if possible, and see if you are right about this
按次数下载不扣除下载券;
注册用户24小时内重复下载只扣除一次;
顺序:VIP每日次数-->可用次数-->下载券;
- 上海交通大学:《物理实验》精品课程教学资源(讲义)刚体的转动惯量的测量new_E_3.doc
- 上海交通大学:《物理实验》精品课程教学资源(讲义)刚体的转动惯量的测量new_E_2.doc
- 上海交通大学:《物理实验》精品课程教学资源(讲义)PN结物理特性的测量_E.doc
- 上海交通大学:《物理实验》精品课程教学资源(讲义)8 超声相干.doc
- 上海交通大学:《物理实验》精品课程教学资源(讲义)8 Thermal Conductivity Measurement of Good Thermal Conductors Copper and Aluminum_final.doc
- 上海交通大学:《物理实验》精品课程教学资源(讲义)7 信号FOURIER分析.doc
- 上海交通大学:《物理实验》精品课程教学资源(讲义)7 The transient digital measurement of the collision process_final.pdf
- 上海交通大学:《物理实验》精品课程教学资源(讲义)7 The transient digital measurement of the collision process_final.docx
- 上海交通大学:《物理实验》精品课程教学资源(讲义)6 偶极子.doc
- 上海交通大学:《物理实验》精品课程教学资源(讲义)6 Measurement of refractive index with the Abbe refractometer_final.docx
- 上海交通大学:《物理实验》精品课程教学资源(讲义)5 空气动力学.doc
- 上海交通大学:《物理实验》精品课程教学资源(讲义)5 Study forced vibration with Boer resonance instrument_final1.pdf
- 上海交通大学:《物理实验》精品课程教学资源(讲义)5 Study forced vibration with Boer resonance instrument_final1.docx
- 上海交通大学:《物理实验》精品课程教学资源(讲义)4 光速及透明介质的折射率测定讲义.doc
- 上海交通大学:《物理实验》精品课程教学资源(讲义)4 Measuring the Young Modulus of Metal by Dynamic Suspension Method.doc
- 上海交通大学:《物理实验》精品课程教学资源(讲义)3 一维运动.doc
- 上海交通大学:《物理实验》精品课程教学资源(讲义)3 Measuring the Moment of Inertia of Rigid Body.doc
- 上海交通大学:《物理实验》精品课程教学资源(讲义)2 自由落体.doc
- 上海交通大学:《物理实验》精品课程教学资源(讲义)2 Measuring the Linear Expansion Coefficient of Metals by Optical Lever Method.doc
- 上海交通大学:《物理实验》精品课程教学资源(讲义)1 弦线振动.doc
- 上海交通大学:《物理实验》精品课程教学资源(讲义)10 THERMAL RADIATION SYSTEMnew.doc
- 上海交通大学:《物理实验》精品课程教学资源(讲义)10热辐射.doc
- 上海交通大学:《物理实验》精品课程教学资源(讲义)14 ACDC ELECTRONICS LABORATORY.doc
- 上海交通大学:《物理实验》精品课程教学资源(讲义)17 BASIC CURRENT BALANCE-e1new.doc
- 上海交通大学:《物理实验》精品课程教学资源(讲义)17电流平衡.doc
- 上海交通大学:《物理实验》精品课程教学资源(讲义)19 SLIT ACCESSORY-2.doc
- 上海交通大学:《物理实验》精品课程教学资源(讲义)19衍射光学-1.doc
- 上海交通大学:《物理实验》精品课程教学资源(讲义)2 Free Falling Body.doc
- 上海交通大学:《物理实验》精品课程教学资源(讲义)20 SPECTROPHOTOMETER SYSTEM-3.doc
- 上海交通大学:《物理实验》精品课程教学资源(讲义)20光谱-2n.doc
- 上海交通大学:《物理实验》精品课程教学资源(讲义)22 MICROWAVE OPTICS.doc
- 上海交通大学:《物理实验》精品课程教学资源(讲义)22微波光学.doc
- 上海交通大学:《物理实验》精品课程教学资源(讲义)23 ADVANCED OPTICS SYSTEM-1.doc
- 上海交通大学:《物理实验》精品课程教学资源(讲义)23高级光学系统实验手册2n.doc
- 上海交通大学:《物理实验》精品课程教学资源(讲义)3 Studies of 1D Movement on Air Track.docx
- 上海交通大学:《物理实验》精品课程教学资源(讲义)4 LightSpeed.doc
- 上海交通大学:《物理实验》精品课程教学资源(讲义)5 Aerodynamics.doc
- 上海交通大学:《物理实验》精品课程教学资源(讲义)6 Antenna.doc
- 上海交通大学:《物理实验》精品课程教学资源(讲义)7 FOURIER SYNTHESIZER(仪器更新,内容略有变动).doc
- 上海交通大学:《物理实验》精品课程教学资源(讲义)7 FOURIER-Analysis.doc
