《建筑给水排水工程》课程教学案例(PPT讲稿)ClO2 Impact on RO Membrane ECO vs XFR Case Study

DOW ClO2 Impact on RO Membrane ECO vs XFR Case Study Echo Zhao,Cheng Yang,Hugh Zhu,Yanhong He,Robert Chu
ClO2 Impact on RO Membrane ECO vs XFR Case Study Echo Zhao, Cheng Yang, Hugh Zhu, Yanhong He, Robert Chu
Outline .ClO2 impact on RO One Project Highlight for WRU in China ClO2 Impacts on RO summary Membrane Soaking Test at ClO2/Hypochlorite Solution .ECO vs XFR case study ·Pilot Overview ECO's Advantage for Energy Saving and Permeate Quality Dow
Outline •ClO2 impact on RO • One Project Highlight for WRU in China • ClO2 Impacts on RO summary • Membrane Soaking Test at ClO2/Hypochlorite Solution •ECO vs XFR case study • Pilot Overview • ECO’s Advantage for Energy Saving and Permeate Quality
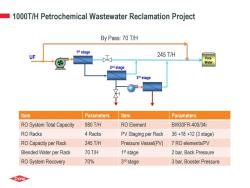
1000T/H Petrochemical Wastewater Reclamation Project By Pass:70 T/H 1st stage UF 245T/H Pure Water 2nd stage 3rd stage Item Parameters Item Parameters RO System Total Capacity 980T/H RO Element BW30FR-400/34i RO Racks 4 Racks PV Staging per Rack 36+18+12(3 stage) RO Capacity per Rack 245T/H Pressure Vessel(PV) 7 RO elements/PV Blended Water per Rack 70T/H 1st stage 2 bar,Back Pressure RO System Recovery 70% 3rd stage 3 bar,Booster Pressure Dow
1000T/H Petrochemical Wastewater Reclamation Project 1 st stage 2 nd stage 3 rd stage Pure Water UF By Pass: 70 T/H Item Parameters Item Parameters RO System Total Capacity 980 T/H RO Element BW30FR-400/34i RO Racks 4 Racks PV Staging per Rack 36 +18 +12 (3 stage) RO Capacity per Rack 245 T/H Pressure Vessel(PV) 7 RO elements/PV Blended Water per Rack 70 T/H 1 st stage 2 bar, Back Pressure RO System Recovery 70% 3 rd stage 3 bar, Booster Pressure 245 T/H
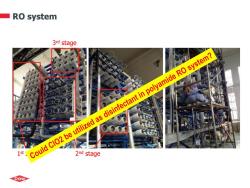
RO system 3rd stage Could ClO2 be utilized as disinfectant in polyamide RO system? 1st 2nd stage
RO system 1 st stage 2 nd stage 3 rd stage
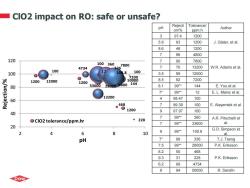
ClO2 impact on RO:safe or unsafe? Tolerance/ pH Rejecti on/% Author ppm.h 3 97.4 1200 5.8 93 1200 J.Glater,et al. 8.6 48 1200 7 96 4800 120 7 90 7800 100 360 7800 4734 336 7 70 13200 W.R.Adams et al 100 100 12 100.8 100 3.5 99 12000 ¥ 0 1200 12000 8.5 92 7200 1200 80 3360028000 8.1 99* 144 E.You et al. 7* 99* 12 E.L.Mainz et al. 13200 98.47 100 里 46 7 99.39 100 E.Alayemiek et al. 1200 40 9 97.97 100 7 99* 360 ClO2 tolerance/ppm.hr ●228 A.R.Pitochelli et 1 99* 33600 20 2 4 6 10 e 99* 100.8 G.D.Simpson et al. pH 99 336 T.J.Tseng 7.5 99* 28000 P.K.Eriksson 8.2 50 468 9.3 31 228 P.K.Eriksson 6.2 99 4734 94 50000 R.Sandin Dow
ClO2 impact on RO: safe or unsafe? 1200 1200 1200 4800 7800 13200 12000 7200 144 100 1 2 100 100 360 33600 100.8 336 28000 468 228 4734 50000 20 40 60 80 100 120 2 4 6 8 10 Rejection/% pH ClO2 tolerance/ppm.hr pH Rejecti on/% Tolerance/ ppm.h Author 3 97.4 1200 5.8 93 1200 J. Glater, et al. 8.6 48 1200 7 96 4800 W.R. Adams et al. 7 90 7800 7 70 13200 3.5 99 12000 8.5 92 7200 8.1 99** 144 E. You et al. 7* 99** 12 E. L. Mainz et al. 4 98.47 100 7 99.39 100 E. Alayemiek et al. 9 97.97 100 7 99** 360 A.R. Pitochelli et 7 99** 33600 al. 8 99** 100.8 G.D. Simpson et al. 7* 99 336 T.J. Tseng 7.5 99** 28000 P.K. Eriksson 8.2 50 468 9.3 31 228 P.K. Eriksson 6.2 99 4734 8 94 50000 R. Sandín
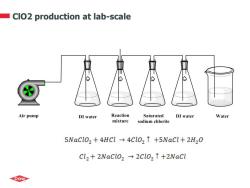
ClO2 production at lab-scale Air pump DI water Reaction Saturated DI water Water mixture sodium chlorite 5NaClo,+4HCl 4C10,1 +5NaCl+2H2O Cl2+2Nacl02→2cl02↑+2Nacl Dow
ClO2 production at lab-scale
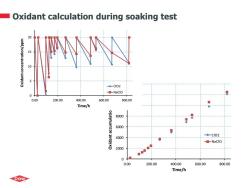
Oxidant calculation during soaking test A ◆-C102 -NaClo 0.00 200.00 400.00 600.00 800.00 ◆ Time/h 8000 6000 4000 c102 ☏-NaClO 2000 0 0.00 200.00 400.00 600.00 800.00 Time/h Dow
Oxidant calculation during soaking test 0 2000 4000 6000 8000 10000 12000 14000 0.00 200.00 400.00 600.00 800.00 Oxidant accumulation/ppm.h Time/h ClO2 NaClO 0 5 10 15 20 0.00 200.00 400.00 600.00 800.00 Oxidant concentration/ppm Time/h ClO2 NaClO
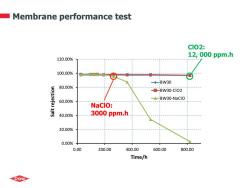
Membrane performance test C02: 12,000ppm.h 120.00% 100.00% ◆BW30 80.00% 鲁BW30-C102 uolppafau iles 盒BW30-NaClO 60.00% NaClO: 40.00% 3000 ppm.h 20.00% 0.00% 0.00 200.00 400.00 600.00 800.00 Time/h Dow
Membrane performance test 0.00% 20.00% 40.00% 60.00% 80.00% 100.00% 120.00% 0.00 200.00 400.00 600.00 800.00 Salt rejection Time/h BW30 BW30-ClO2 BW30-NaClO NaClO: 3000 ppm.h ClO2: 12, 000 ppm.h
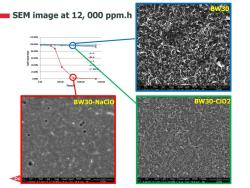
BW30 SEM image at 12,000 ppm.h 120.00% 100.00% 800% 60.00% 40.00% 2n0% 0.00 0.00 500.00 000.00 500.0 BW30-NaCIo BW30-CIO2 D 5wP3网,Wme
0.00% 20.00% 40.00% 60.00% 80.00% 100.00% 120.00% 0.00 500.00 1000.00 1500.00 Salt rejection Time/h A B C D BW30 BW30 BW30-NaClO BW30-ClO2 DOW RESTRICTED SEM image at 12, 000 ppm.h
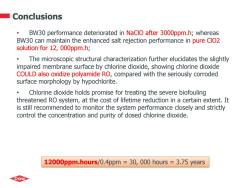
Conclusions 。 BW30 performance deteriorated in NaClO after 3000ppm.h;whereas BW30 can maintain the enhanced salt rejection performance in pure ClO2 solution for 12,000ppm.h; The microscopic structural characterization further elucidates the slightly impaired membrane surface by chlorine dioxide,showing chlorine dioxide COULD also oxidize polyamide RO,compared with the seriously corroded surface morphology by hypochlorite. Chlorine dioxide holds promise for treating the severe biofouling threatened RO system,at the cost of lifetime reduction in a certain extent.It is still recommended to monitor the system performance closely and strictly control the concentration and purity of dosed chlorine dioxide. 12000ppm.hours/0.4ppm =30,000 hours 3.75 years Dow
Conclusions • BW30 performance deteriorated in NaClO after 3000ppm.h; whereas BW30 can maintain the enhanced salt rejection performance in pure ClO2 solution for 12, 000ppm.h; • The microscopic structural characterization further elucidates the slightly impaired membrane surface by chlorine dioxide, showing chlorine dioxide COULD also oxidize polyamide RO, compared with the seriously corroded surface morphology by hypochlorite. • Chlorine dioxide holds promise for treating the severe biofouling threatened RO system, at the cost of lifetime reduction in a certain extent. It is still recommended to monitor the system performance closely and strictly control the concentration and purity of dosed chlorine dioxide. 12000ppm.hours/0.4ppm = 30, 000 hours = 3.75 years
按次数下载不扣除下载券;
注册用户24小时内重复下载只扣除一次;
顺序:VIP每日次数-->可用次数-->下载券;
- 《建筑给水排水工程》课程教学案例(PPT讲稿)反渗透前处理过程中滤芯使用寿命的探究.ppt
- 《建筑给水排水工程》课程教学案例(PPT讲稿)北京市综合管廊规划建设现状及发展趋势.ppt
- 《建筑给水排水工程》课程教学案例(PPT讲稿)综合管廊国家建筑标准设计介绍.pptx
- 《建筑给水排水工程》课程教学案例(PPT讲稿)城市地下综合管廊信息化建设.pptx
- 《建筑给水排水工程》课程教学案例(PPT讲稿)昆明市地下综合管廊建设管理实践.pptx
- 《建筑给水排水工程》课程教学案例(PPT讲稿)美国地下管线设施事故预防与事故数据分析.pptx
- 《建筑给水排水工程》课程教学资源(学习资料)给水排水设计指南.pdf
- 《建筑给水排水工程》课程教学大纲 Engineering of Water Supply and Drainage for Building.pdf
- 《水泵与水泵站》课程教学课件(PPT讲稿)第四章 水泵的汽蚀与安装高程确定.ppt
- 《水泵与水泵站》课程教学课件(PPT讲稿)第六章 水泵选型和配套.ppt
- 《水泵与水泵站》课程教学课件(PPT讲稿)第八章 进出水建筑物设计.ppt
- 《水泵与水泵站》课程教学课件(PPT讲稿)第五章 泵站工程规划.ppt
- 《水泵与水泵站》课程教学课件(PPT讲稿)第二章 叶片泵的基本理论.ppt
- 《水泵与水泵站》课程教学课件(PPT讲稿)第三章 叶片泵的运行特性及调节.ppt
- 《水泵与水泵站》课程教学课件(PPT讲稿)第七章 泵房.ppt
- 《水泵与水泵站》课程教学课件(PPT讲稿)第一章 泵的基础知识(2/2).ppt
- 《水泵与水泵站》课程教学课件(PPT讲稿)第一章 泵的基础知识(1/2).ppt
- 《水泵与水泵站》课程教学资源(文献资料)管道和水泵简易计算法.pdf
- 《水泵与水泵站》课程教学课件(PPT讲稿)离心泵的结构知识.ppt
- 《水泵与水泵站》课程教学课件(PPT讲稿)离心泵的基础知识,技术参数及汽蚀、吸附特性.ppt
- 《建筑给水排水工程》课程教学资源(PPT课件,无动画素材)第一章 绪论.ppt
- 《建筑给水排水工程》课程教学资源(PPT课件,无动画素材)第七章 雨水排水系统.ppt
- 《建筑给水排水工程》课程教学资源(PPT课件,无动画素材)第三章 增压贮水设备.ppt
- 《建筑给水排水工程》课程教学资源(PPT课件,无动画素材)第九章 其它设施简介.ppt
- 《建筑给水排水工程》课程教学资源(PPT课件,无动画素材)第二章 建筑内部给水工程.ppt
- 《建筑给水排水工程》课程教学资源(PPT课件,无动画素材)第五章 室内消防给水系统(1/2).ppt
- 《建筑给水排水工程》课程教学资源(PPT课件,无动画素材)第五章 室内消防给水系统(2/2).ppt
- 《建筑给水排水工程》课程教学资源(PPT课件,无动画素材)第八章 室内热水供应系统.ppt
- 《建筑给水排水工程》课程教学资源(PPT课件,无动画素材)第六章 建筑内部排水系统.ppt
- 《建筑给水排水工程》课程教学资源(PPT课件,无动画素材)第四章 建筑内部给水系统的计算.ppt
- 《水文地质学》课程教学课件(PPT讲稿)综合水文地质图编制要求.ppt
- 《水文地质学》课程教学资源(文献资料)渑池县九六八煤业有限责任公司水文地质报告.doc
- 《水文地质学》课程作业题库(含参考答案).doc
- 中国农业大学:《水利水能规划》课程教学大纲 Water Resources and Hydropower Planning.pdf
- 中国农业大学:《水利水能规划》课程教学课件(讲稿)绪论(主讲:贺向丽).pdf
- 中国农业大学:《水利水能规划》课程教学课件(讲稿)第二章 兴利调节.pdf
- 中国农业大学:《水利水能规划》课程教学课件(讲稿)第一章 水资源的综合利用.pdf
- 中国农业大学:《水利水能规划》课程教学课件(讲稿)第三章 洪水调节.pdf
- 中国农业大学:《水利水能规划》课程教学课件(讲稿)第四章 水利水电经济计算与评价 Economic Calculation and Evaluation for Hydropower.pdf
- 中国农业大学:《水利水能规划》课程教学课件(讲稿)第五章 水能计算 Hydro-Power Calculation 5.2 水能计算(主讲:张昕).pdf
